Hello Everyone, I just got my deposit filled today and officially I am LIVE!! I know somehow I am just excited to have money in a broker. I am going to focus on strategies that use Support/Resistance (supply/demand). Some Background on me I guess is in order. I just assume I am going to dump this account but I am going to try very hard not to. This is going to be my trade journal and a place I hope others will give there opinions on my trades. I hope my journey will be an interesting one with at least some kinda success. I will focus on the Majors Fiber, Cable, USD/JPY and USD/CHF. I will post my method coming up and as my experience grows I will keep updating my method. At first we are going to start on the conservative side of things and have a very narrow focus.
make sure the scissors are pointing down… good luck in your endeavor
[B]My Trading Plan:[/B]
[I]
Primary Objective: To not bust my account and gain experience.
Secondary Objective: Make some pips!![/I]
[U]Method:[/U]
Use Price Action and lean on large order flow.
Tools:
Support/Resistance
Trend lines
Pivots
Fib
Risk Management: everything will be in Reward:Risk and then % equity per trade
1:1 - .25%
2:1 - .33%
3:1 - .5%
4:1 and above - .66%
Total Risk in Market: 3.5%
Max trades in 1 day: 5
[U]Weekly Goal: 50 pips[/U]
Time frames: I will not trade anything lower than 1 hour.
Currencies: EUR/USD, GBP/USD, USD/CHF, USD/JPY
Conclusion: Seriously this is as simple as it gets. I will try to use Price action and S/R levels. I have a very conservative Risk Management system because the goal of this is to become experienced and not go broke. As I become more experienced then I may alter my RM and goals but until that time it will be very conservative.
Intra-day trading plan:
Currencies: same as above
Risk Management:
1:1 & 2:1- .15%
3:1 + - .30%
Times: London Open and New York Open (these are my prime targets)
Notes: I wanted to add some more to my trading plan regarding short term trades. All of my swing positions are set up on Monday usually. This means I am hands off for the entire week. But I wont get much practice in just doing that, also I think intra-day trading is a great skill to have. I had been using my risk reward ratios above but after successive losses I think that I should decrease my risk. I contemplated doing this on demo but i don’t really feel it like i do live and i think i am more sloppy. I am going to target the LO and NYO as my prime areas because of the cross overs. I haven’t lost what anyone would consider a lot of money. But extending my BR’s lifespan and getting more experience out of it is the key right now.
If you’re running naked with scissors, I would say you’re not quite properly prepared for the activity at hand…
You might want to pull your money back out of the account, and invest in a pair of running shoes, and a kevlar jumpsuit.
And as Kenny10Pips said, keep those suckers pointed down…
Thank you Master Tang and Kenny10Pips I am glad you care about my financial health and trading lifeline. I know your intentions are good but the title should not be taken so serious. But i guess the people at babypips are serious about trading and thats why i like this forum so much. Anyway I am going to continue this journal and my live account inspite of their advice which in fact may blow up in my face. But I am confidant in my thinking and methods so i will soldier on. I hope that as this journal goes on people will continue to give me input. Please stop by again!
Today I had 3 setups but i placed my entry very conservatively and deep into my zones. Unfortunately none of my orders got triggered and now its coming to the end of the London/NewYork Cross over and its Friday. But I can take solace that there was a price reaction at each zone I indicated. So today i am just going to walk away and remain flat over the weekend. See you guys next week.
Well, just don’t put all your money of saving account for the live account  Then, this may be good starting for fighting against tempting-emotional desire to get in trades which I personally don’t feel at all in demo trading.
And it’s good for you if you write down what exactly triggered you to trade. For example, saying like this: yesterday, longing fiber with 1 hour chart, entered the trade with setup of 78.5 fib. and S1 daily pivot entry with doji candle, and placed stop at 30 pips below the entry…blah blah blah. This retrospective would help you to see how you made good/bad trade. By the way, loss doesn’t mean bad trade in my sense.
Good luck!
Absolutely. This account is very manage about and only 5% of what I want to completely invest into forex. I have a scaling system to continue to add capital to my account as I become more successful. However that system will not begin for several months. I have a huge notebook of my ideas and my ‘trading rules’ here on my desk so there is a lot not covered in my original posting.
On to the reasoning for my trades. I would like to post charts for all my trade zones and trading ideas with comments so others can see my thinking. Although since it was my first day I didn’t have much time before London Open to get that prepared. Starting next week I will have all of that set up.
Derek…looks like your off to a good start. I’m looking forward to seeing some charts, and making some comments. But so far so good… this stuff can make you money. I agree with Sasa too, the more you write down about your trades, the better!
Jay
This is the first time i have posted this up so my format might change. Also my scoring system is not 100% quantitative (systematic) I am still in the process of refining. Though It ranges from unacceptable to acceptable to good to great to excellent. I am not responsible for what you do with this information it is purely my opinion.
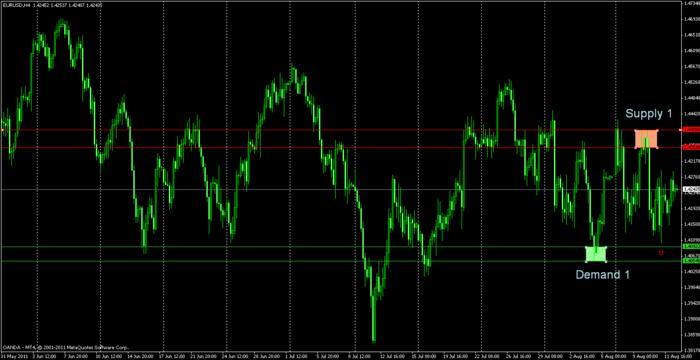
EUR/USD Aug 14th 2011 Overview
The BIG PICTURE
Monthly Chart Analysis

Remarks: This chart shows that the monthly has after a large rally begun to make lower highs and lower lows. This month has a massive upside wick but has been pushed down below opening. Also the volatility and range of the market has increased. The sizes of the candle before the largest peak and the sizes of the candles after are on average much larger.
Zone Notes:
Supply- The supply zone was touched once this month, and it was penetrated 90% of the way through. This is a minus for this zone. However, since it has shown a large amount of strength to push down the candle down 2.77:1 the size of the zone. If it breaks 3:1 then I can consider it a new zone. But we will have to see how this candle closes and reevaluate.
Score : Not Acceptable
Demand- This zone started the origin of the slow climb up to the largest swing high. This zone has also been touched again but had a faster reaction. Although this had a pretty severe speed bump candle and not a smooth rebound. But the range of movement away from the level was quite significant at 7.17:1. We have to see the action that brings us back to the level to and that could upgrade this zone to good.
Score: Acceptable
Weekly Chart Analysis.

The weekly chart is used to get a more detailed view of the picture. Using this smaller time frame you can decrease your risk. However with the supply level on top the wick still penetrates a large portion of the level even zoomed in. Therefore I can not upgrade its score. The demand level does not increase because it is already maxed out on the score for risk reward. Overall going to look for SHORTS
Micro Picture:
Daily Chart:

Overall we are ranging on the daily. After the large rally we had originating at Demand 2. We have a lot of congestion in the last few days. But we all know that this is very much news related and this last week has been volatile. However in this case none of these levels have been touched before.
Demand Zones: Demand level 1 was close to being touched but price was pushed away without touching it, this is a huge indicator of strength from that zone. However the wick is very large which I don’t really like. However it is still offering 3:1 which validates this as a level. But this is barely meeting the requirements so I would keep an eye on a trade that I took from this level. Also use a smaller lot size.
Demand level 2 is good. I started a huge move and spent very little time at the level. It also sits on the edge of the overall supply/demand curve. Also this is a distal level which gives it much more implied strength.
Supply Zone 1: The overall down slide from this zone is ~5.25:1. However there is a significant retracement here. Although it does show strength because the next high gets close to this level and then swings away. As with all shorts this is going with are bias. It spent a borderline amount of time at this level which decreases its strength.
Supply 1 score: acceptable
Supply Zone 2: It is the distal level in line with our directional bias. However one negative is that it has too many candles for my liking. Its offering 5:1 which is quite good. Overall this is still a good level because of the level before it and its position on the supply demand curve.
Supply 2 score: Good
4H Chart:

Supply 1: is offering 5.3:1 which is quite good. I also like the large quick drop from this level. You could say that the previous high was this level as well. But since it is offering larger than 3:1 I consider it a new untouched level. It is also going in the over all direction of the trend. I would say this is a high probability trade.
Supply 1 score: Great
Demand 1: this level is offering from low to high about 8:1 but the small bull flag does decrease it speed upward. But this goes against our trend bias so that is another minus against its score. I would say that there is definitely going to be a reaction here. Also the candle with the arrow pointed at it got close to the level but then was pushed away without even touching the level and never reached that low again since. This is a smaller scalp type trade you can receive easily 30-50 pips from this level. I would remove some of my position after that point and let the rest ride and move stop to BE.
Demand 1 score: acceptable


GBP/USD Aug 14th 2011 Overview
The BIG PICTURE
Monthly Chart Analysis

Overview: We came from a huge drop down after a huge amount of indecision candles. Looks like we are going to have a double top form. My overall impression is a down trend. Therefore my bias is towards SHORTS.
Supply 1: this actually doesn’t qualify as a level at all to me. It has way too many candles and they are after the original origin of the move.
Supply1: Not acceptable
Demand 1: this level also does not meet my minimum requirements. It has already been retraced into once and the price reaction was very slow and had several bear candles in it.
Demand 1: Not acceptable.
Weekly Chart Analysis.

Getting a more granular picture of the larger timeframe. We can see that Supply 1 may actually be an acceptable level if you just take the measurement to the X. However in the zoom in of the original monthly demand you can see that that is just a mess in there and nothing can be taken there.
Supply 1: Taking this level to the x offers up about 4.5:1. This would qualify this as a level. But it is not as strong as one would have guessed if you took the whole measurement. Or looked at the huge drop off from the monthly. Unfortunately this there are a lot of candles here. This is a borderline case, with high levels of risk management and some babysitting I think you could squeeze some pips from this. But since I am sticking to a conservative look at things.
Supply 1 Score: Not acceptable.
Demand 1: this level offers up ~4.4:1 which is pretty good. The speed the price leaves the level is good with one bear candle that gets immediately engulfed. Also this level is completely fresh and nothing has gotten close to it since it has level here. The amount of time that was spent here is completely in range for me.
Demand 1 score: Good
Micro Analysis:
Daily Time Frame

Here we are definitely making lower highs and lower lows. So our monthly biased is reflected in the daily time frame.
Supply 1: This level offers around 4.25:1. However it is quite a wide level and the amount of candles is just under the maximum for me. Although the speed at which it dropped was not as fast as I usually like. Also there is a huge up wick and some congestion down at the bottom. I would definitely take profit before we reached the wicks of the bottom candles. Maybe even take off part of my earnings on the ranging part mid way through the drop. This is more risky than I would like to see for a swing trade. There is defiantly going to be a price reaction here. If you can zoom in and increase your RR before reaching congestion this would be a better trade. But on this time frame,
Supply 1 score: Not Acceptable
Demand 1: now this is the least amount of time price can be at a level. Just one hammer. Although the initial push up is quite fast the wick of this candle makes it less enticing. To the next swing high we get around 3.25:1 but to the top of the initial rush up we are getting about 1.6:1. To reduce our risk I would take some profit off there and let 50% ride out while moving my SL to BE. This level is untouched as well. With this plan in mind I believe this is acceptable
Demand 1 score: Acceptable
4H time frame.

This chart is a mess the last several days. There aren’t any really supply levels that really show something to me. All of the levels since the 22nd have been touched several times and driven through. However this gives us a better picture of the origin of our previous demand level
Demand 1: This is a more zoomed in picture. Here we can see much better and lower our risk by making our entry more precise. Now from the top of this level to the red arrows candle top is offering just about 9:1. If we take it to the yellow arrow we are offered 5.1. There was a some choppiness leading up to the largest candle on the upswing. But these are very good RRRs. My strategy would be moving my SL to BE once we reached the area where there was come congestion. Take 50% off at the yellow arrow and let the rest ride out.
Demand 1 –zoomed in: Good
goodness… are you sure you’re new? LoL to me this is as complicated as possible. i was attracted to “price action” but unfortunately i don’t understand at all 
anyway… good luck with the trade
JUst looked at the entire thread.
I would commend the effort that has gone in.
Just feel that you are over doing it when all you want to do is click buy or sell.
Those who go too deep into it when they are begining always tend to loose the plot and end up over complicating things and not make a buck.
All this is good and well…on hindsight.
The game plan has to be more simple, the analysis has to be less complicated. And most importantly more flexible.
There are no absolutes to it when the market is yet to move. Absolutes of supply and demand can only be seen in hindsight, after the move has been completed. Until then its all not certain.
That in itself is not a good way to trade.
Nikita… I disagree. Although you are correct in saying “absolutes”, and “all not certain”, I personally trade this way almost exclusively, and I do this for a living. I think you will be surprised to see how price reacts at the levels that Meihau has illustrated once price does eventually return to them. It is not exact science of course…but does it provide enough of an edge to make a good profit in the market? Yes.
I, for one, use previous market turning points as the entire foundation for my trading methodology. A few of the factors I consider when doing such an analysis is how long price spent at a price zone before turning, how quickly it moved once it did turn, and how far the eventual price move was away from that turning point, before it returned.
Although he is putting in more work than may be necessary to trade, an extremely thorough analysis allows one to be extremely discriminating while reviewing prior trades, and determining what one overlooked, and what mistakes were made. This type of extremely objective review is only possible with a very detailed accounting of what inspired the order to be set in the first place.
It is not the only way, of course not! Trading styles and methods are about as unique as traders…each one takes a slightly different path, but I will say that an analysis to nearly this degree is one thing that took me from amature to full time trading. I have not done such a complete breakdown for several months, but I am starting to revert to a more complete analysis myself recently, as I find whenever I do so, I can diagnose my errors with much greater clarity, and correct them more effectively and comprehensivly.
But…it is a lot of work! and may not be necessary, depening on the trader, and the style or method used to decide when to enter a market, in what direction, and where to close the trade for a profit or a loss.
Anyway, to illustrate my point on the effectiveness of prior turning points to determine future turning points, here is the only trade I can show you now… as it is the only trade I am currently in, and I want to show you a real example, not some cherry picked chart.
here it is:

Uploaded with ImageShack.us
If you would like, I can post up a few charts from trades I took last week…heck, could post a few dozen if you want, but i don’t think that’s necessary.
Your right on the point of absolutes…but I would beg to argue the rest of your statement.
Jay
Derek…it looks good, and I should read the entire analysis as some have done to get a better understanding of what your thinking…
but the levels you are choosing look very good.
I would recommend this: start by looking at levels on a 1 hr chart. Then, if you see a drop in price, a base, and then a fast rise; or the opposite, a rise, a period of basing, and then a fast drop, I would then look to see if that turning point corresponds to a high or low for the day (day starting at 5:00 pm E.S.T.)
If it does, AND this level has not been touched several different times (in other words, a fresh or virgin supply or demand level), put an order in there.
Demo it first of course, don’t take my word for it. But as you have analyized, you will have only a few trades a month. This is NOT a bad thing in itself by any means… but for the sake of learning, you will want to obtain a larger sample size to start critiquing your mistakes or oversights.
If you are only taking a few trades a month, it will take you many months to obtain a large enough sample size to start figuring out where your “leaks” are.
If you are able to take a trade or two per day… you can start breaking things down for yourself faster. And i’m not saying with real money…demo this for as long as you want. Just go back and review those demo trades, and try to ask yourself
“what could i have done different? is there something i missed? did i take profit too early? should i NOT have moved a stop to break even? why did price turn down earlier than i thought…can i figure out why?”
These are all very important questions, and the more trades you can SEE…the more completely and quickly you can start answering these questions.
Keep it simple is an advice that can never go wrong
Dont put forex on a pedestal. Dont over analyze things.
ok, I won’t disagree with this. But if a very complete top down analysis helps someone find their own personal trading style … kudos.
Jay
I am sorry that this stuff looks overly complex and a ridiculous amount of effort. Yes things should be kept simple. But the fact of the matter is, this system is very intutative to me. I feel its very simple and can eyeball these levels in seconds. They just pop off the page to me. Every one is different in how they approach things and what matters to me is that it is simple ‘for me’. There are a lot of systems out there that look complex to me but really are simple for others. Take ICT’s system for example i have been studying it for weeks and trying to back test it. I am completely lost. But others think it is just like walking a dog. Also a personal statement, I never believe you can put too much effort in trying to learn or master something.
Yes your absolutely correct. I was actually thinking of using 4H and 1H for intra-day trading. With my smallest lot size, (real money). I have confidence that i can see the levels and have back tested several (2.5) years cable and fiber using those time frames in profit and with an average of 55% win rate. These levels are swing to almost position trades as my targets are several hundreds of pips. I will look for good opportunistic shots for ‘scalps’ or intra day trades with minimum targets of 10-15 pips. Thank you for all your teaching and support Jay.
great stuff here Meihua!
you can’t be THAT naked if you put this much thought and analysis into every trade. kudos!
hope live trading works out for you.