Santa’s rally refers to the tendency for equity markets to rally into the end of the year. Today we take a closer look at this phenomenon on the S&P 500.
By :Matt Simpson, Market Analyst
It is well known that stock market indices tend to rise over the longer-term. It therefor makes sense that the majority of calendar months in a year deliver positive average returns. Yet not all months are equal. Some months may deliver stronger average returns yet also have a lower probability of a positive return.
For example, since 1928 the S&P 500 has averaged negative returns but with a 58.9% win rate (a bullish monthly close). Yet October also has a win rate of 58.9% but with a positive average return. And as we’re now in December, it is noting that it has delivered the third strongest returns but with the highest win rate of 72.6%. And that’s why we’re going to take a closer look at December.

S&P 500 technical analysis (intramonth price action for December)
The chart below look at daily data for the S&P 500 in the month of December; the first uses data from 1984 and the second from 1928. This was done to see if there was a significant change between the two, and it is encouraging to see that that are remarkably similar. Both time horizons show that an initial rally in the first week tops out ahead of a shallow pullback, before a strong rally forms ahead of the second half of December and rallies into the year end.

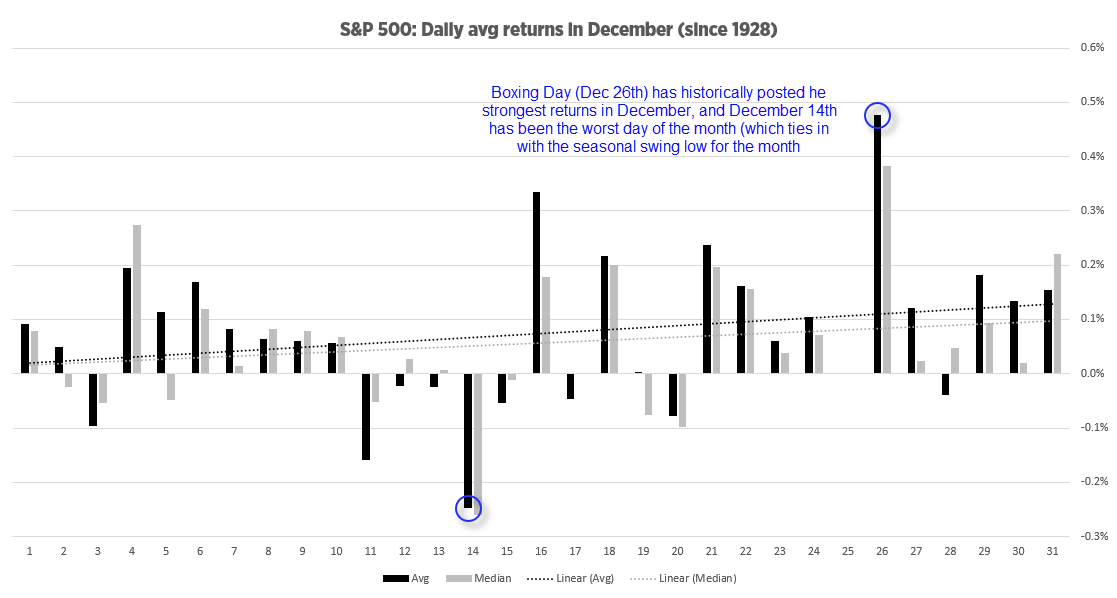
Taking this a step further, we can look at how individual calendar days have averaged in December to see if any positive or negative days stand out. Of course, due to calendar days and days of the week not always aligning there needs to be a pinch of salt here, but it still delivers some interesting observations.
December 26th (Boxing Day) has delivered the strongest average and median returns of the month. This is interesting as traders are assumed to be on holiday over the festive period. But is also requires less to move a market during low-liquidity trade. And whilst I remain unsure as to why Boxing day returns are the standout day of the month, it is something for bears to consider over Christmas.
The strong negative returns on December 14th also ties in with the swing lows on the 13/14th on the above charts ahead of its seasonal rally into the year end.
S&P 500 E-mini futures technical analysis
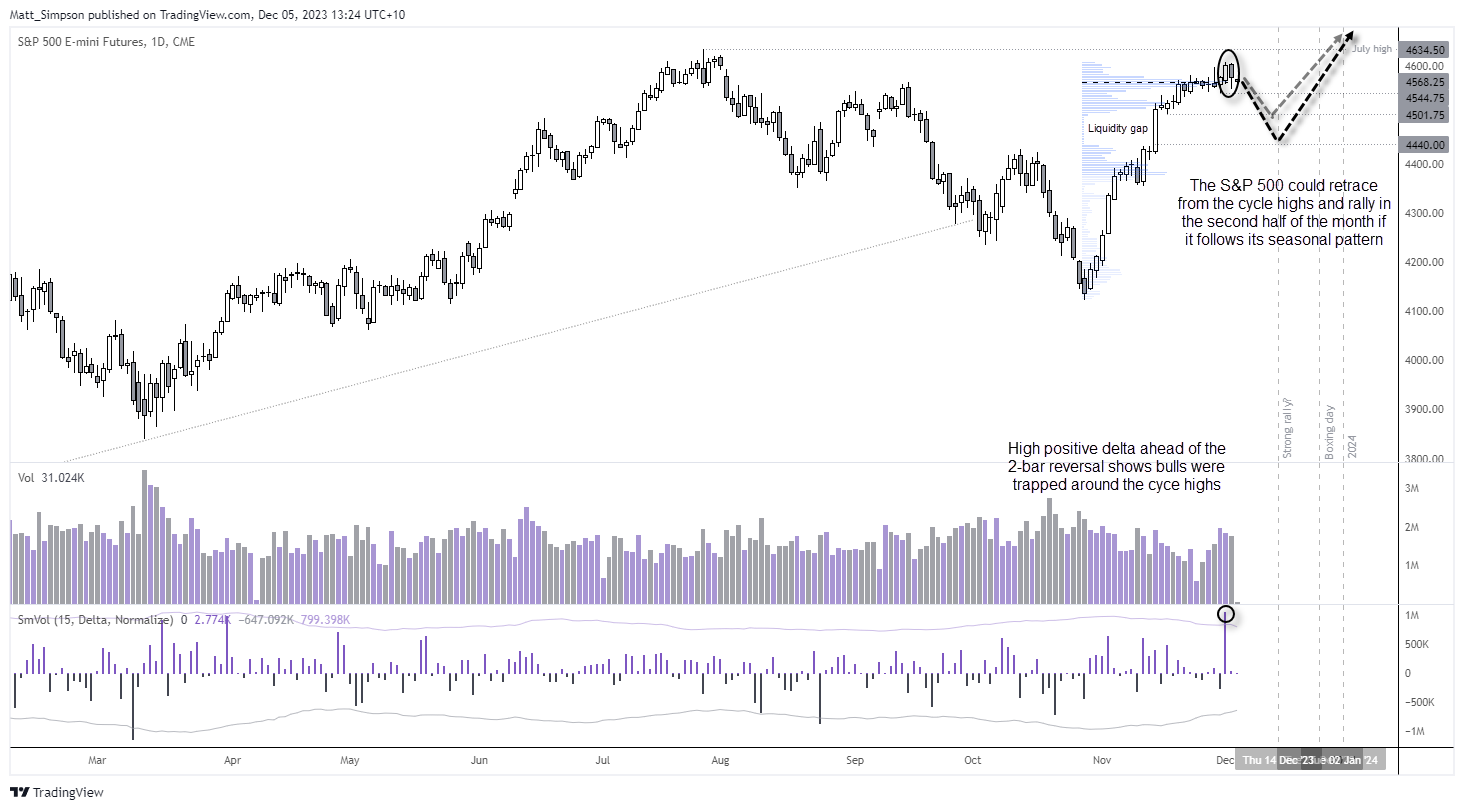
The S&P 500 has delivered a near 12% rally from its late-October low, with little in the way of a pullback. Hopes of Fed cuts in 2024 has delivered the risk-on rally through November, although take note that there are early signs of weakness around the July high.
A 2-bar bearish reversal formed around the cycle highs on Monday to show a hesitancy to simply test that July high. And with a lot of trading activity having taken place around 4565, rising volumes into the highs and a strong positive delta on Friday’s bullish candle, there appears to be many bulls trapped around these highs. And they may feel inclined to cover and fuel a pullback if prices take out last week’s lows around 4545.
Should prices pull back and prices decide to follow their seasonal tendency, bulls may wat to seek dips around 4500 for an anticipated rally from the second half of the month. However, note that liquidity gap between 4440 – 4500 that may want to be filled if prices enter that range.
– Written by Matt Simpson
https://www.forex.com/en-us/news-and-analysis/sp-500-forecast-a-closer-look-at-santas-rally/
The information on this web site is not targeted at the general public of any particular country. It is not intended for distribution to residents in any country where such distribution or use would contravene any local law or regulatory requirement. The information and opinions in this report are for general information use only and are not intended as an offer or solicitation with respect to the purchase or sale of any currency or CFD contract. All opinions and information contained in this report are subject to change without notice. This report has been prepared without regard to the specific investment objectives, financial situation and needs of any particular recipient. Any references to historical price movements or levels is informational based on our analysis and we do not represent or warranty that any such movements or levels are likely to reoccur in the future. While the information contained herein was obtained from sources believed to be reliable, author does not guarantee its accuracy or completeness, nor does author assume any liability for any direct, indirect or consequential loss that may result from the reliance by any person upon any such information or opinions.
Futures, Options on Futures, Foreign Exchange and other leveraged products involves significant risk of loss and is not suitable for all investors. Losses can exceed your deposits. Increasing leverage increases risk. Spot Gold and Silver contracts are not subject to regulation under the U.S. Commodity Exchange Act. Contracts for Difference (CFDs) are not available for US residents. Before deciding to trade forex, commodity futures, or digital assets, you should carefully consider your financial objectives, level of experience and risk appetite. Any opinions, news, research, analyses, prices or other information contained herein is intended as general information about the subject matter covered and is provided with the understanding that we do not provide any investment, legal, or tax advice. You should consult with appropriate counsel or other advisors on all investment, legal, or tax matters. References to FOREX.com or GAIN Capital refer to StoneX Group Inc. and its subsidiaries. Please read Characteristics and Risks of Standardized Options.