Stocks sold off after the CPI report but a threat to fire Powell on Wednesday helped to arrest the declines.
By :James Stanley, Sr. Strategist
S&P 500, Nasdaq, Dow Talking Points:
- The CPI report on Tuesday induced a sell-off in stocks but that was short-lived as President Trump threatened to fire Jerome Powell a day later.
- While Trump may not be able to fire Powell immediately, it’s clear that the U.S. President wants a more dovish Fed chair, and that can happen when Powell’s term concludes in May of next year.
- Nonetheless, given the reaction in stocks this week we can walk away with an idea of what could produce a pullback, and with the Fed meeting set for the Wednesday after next, that could open the door to opportunity.
Click the website link below to read our exclusive Guide to index trading in Q2 2025
https://www.forex.com/en-us/market-outlooks-2025/q2-indices-outlook/

We saw a brief glimpse of the ‘good is bad’ theme peak out last week. On Tuesday morning U.S. inflation came in above expected via headline with Core pushing closer to 3%, which is somewhat illustrative of strength in the U.S. economy, the same strength that has so far disallowed the Fed from cutting rates. And it’s that very hope for rate cuts which was diminished after the data was released that helped to bring a sell-off to equities. The Tuesday session was grinding and bearish, and that led into a spike-lower on Wednesday.
In the Tuesday webinar I warned that we might see something from President Trump on the topic of Jerome Powell’s employment. With USD rallying in the aftermath of the CPI report and equities tilting-lower, the fear was building that the Fed may be even further away from rate cuts than previously hoped. To be sure, Jerome Powell hasn’t sounded all too dovish so far this year, instead saying that he though tariffs would produce inflation that could put the Fed in the uncomfortable spot of being unable to stoke slow growth because of inflation remaining too high.
At this point bullish continuation in equities is a challenge just because of how few pullbacks have shown of late. After the spill in early-Q2, the market’s response around tariffs has seemed to be considerably more positive, driven by the idea that Trump would not up-end the economy. The Fed, however, still hasn’t given markets the dovish drive that they’ve been hoping for and given the reaction last week, where prices pulled back briefly on the back of CPI, we can deduce that a more-hawkish Fed could possibly produce some pullback in stocks.
In the S&P 500, the 6234 level has been the line in the sand and that’s what was defended as support last week. Below that, 6173 is of note as this was a spot of resistance-turned-support, and below that, 6145 is a level with some longer-term importance as that’s the 100% measured move of the 2022 pullback and it’s also what came in to hold highs in February before the tariff-induced sell-off.
If pullbacks can drive below that, which we have to open as a possibility given just how overbought the move has become, then there’s some remaining unfilled gap down to 6025.
S&P 500 Daily Price Chart

Chart prepared by James Stanley; data derived from Tradingview
Nasdaq
The Nasdaq is in a very similar spot as the above with the S&P 500 as both indices ran up to fresh all-time-highs on Friday morning. The weekly low in NDX printed right at a key spot at 22,679 which is a prior spot of resistance-turned-support. That’s the level that bulls would need to retain to keep control of near-term momentum, and if they lose it, it’s a somewhat messy backdrop until we get down to the unfilled gap that runs from 21,856-22,045 which, perhaps coincidentally, came into play after Michelle Bowman’s comment talking up a July rate cut that really doesn’t seem very likely.
Nasdaq 100 Daily Chart
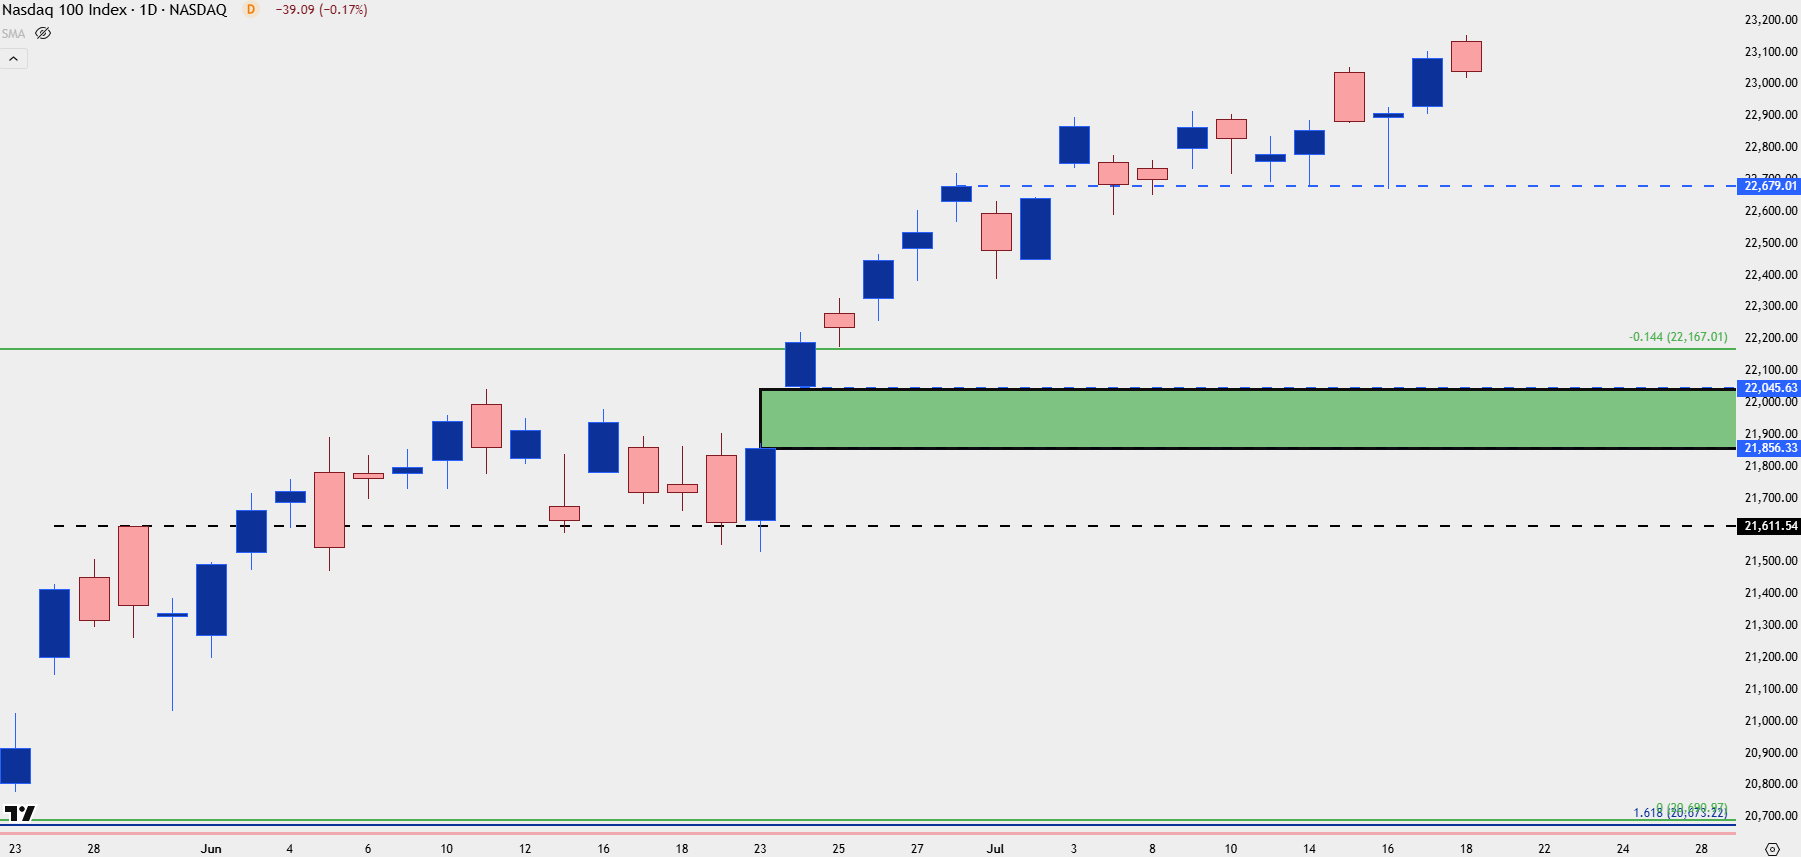
Chart prepared by James Stanley; data derived from Tradingview
Dow Jones
The Dow is an outlier from the above two markets as that index did not set a fresh all-time-high last week. Instead, the index continued to posture below the psychological level of 45,000 which it still hasn’t been able to produce a closed body break on the weekly.
Interestingly, this is the index that could probably have a more bullish argument than the above two markets because of that, also combined with the pullback and indecision on the weekly bar after the gap from June was finally filled. That sets the stage for a possible test of 45k as we move towards the July rate decision on the Wednesday after next.
Dow Jones Weekly Chart
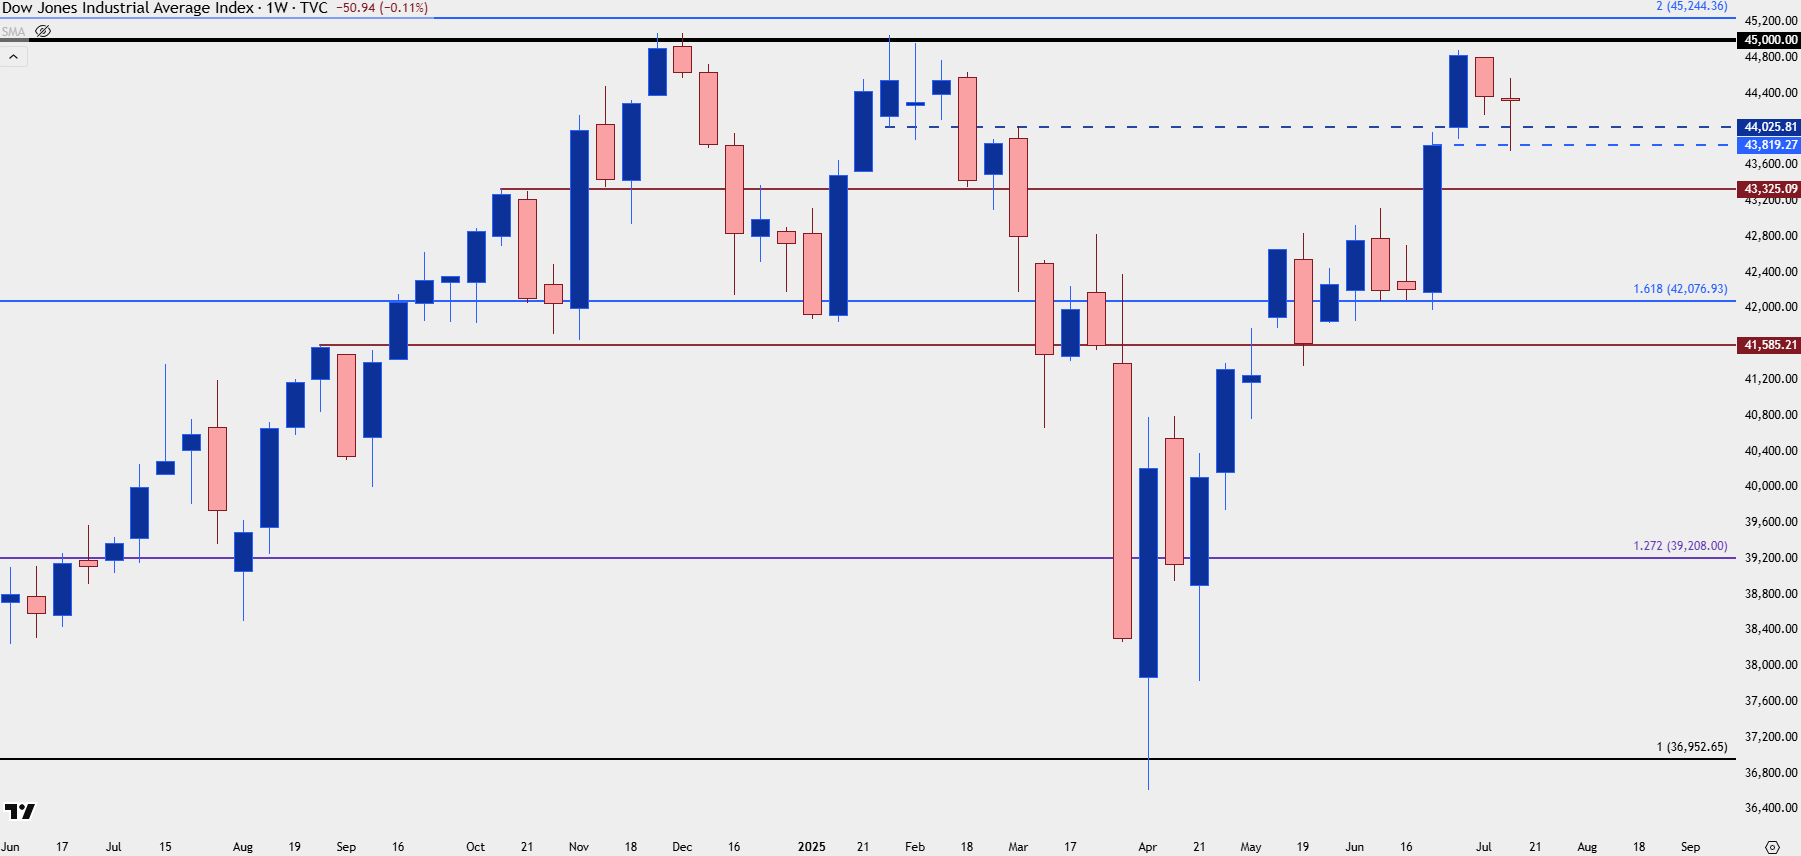
Chart prepared by James Stanley; data derived from Tradingview
Dow Daily
The daily chart of the Dow can offer some additional context as the support at 43,819 is somewhat of a line in the sand. A pullback to and show of support at 44,025 keeps the door open for bullish continuation, but if sellers break through 43,819, the net significant spot of support doesn’t appear until the 43,386-43,505 zone.
Dow Jones Daily Price Chart
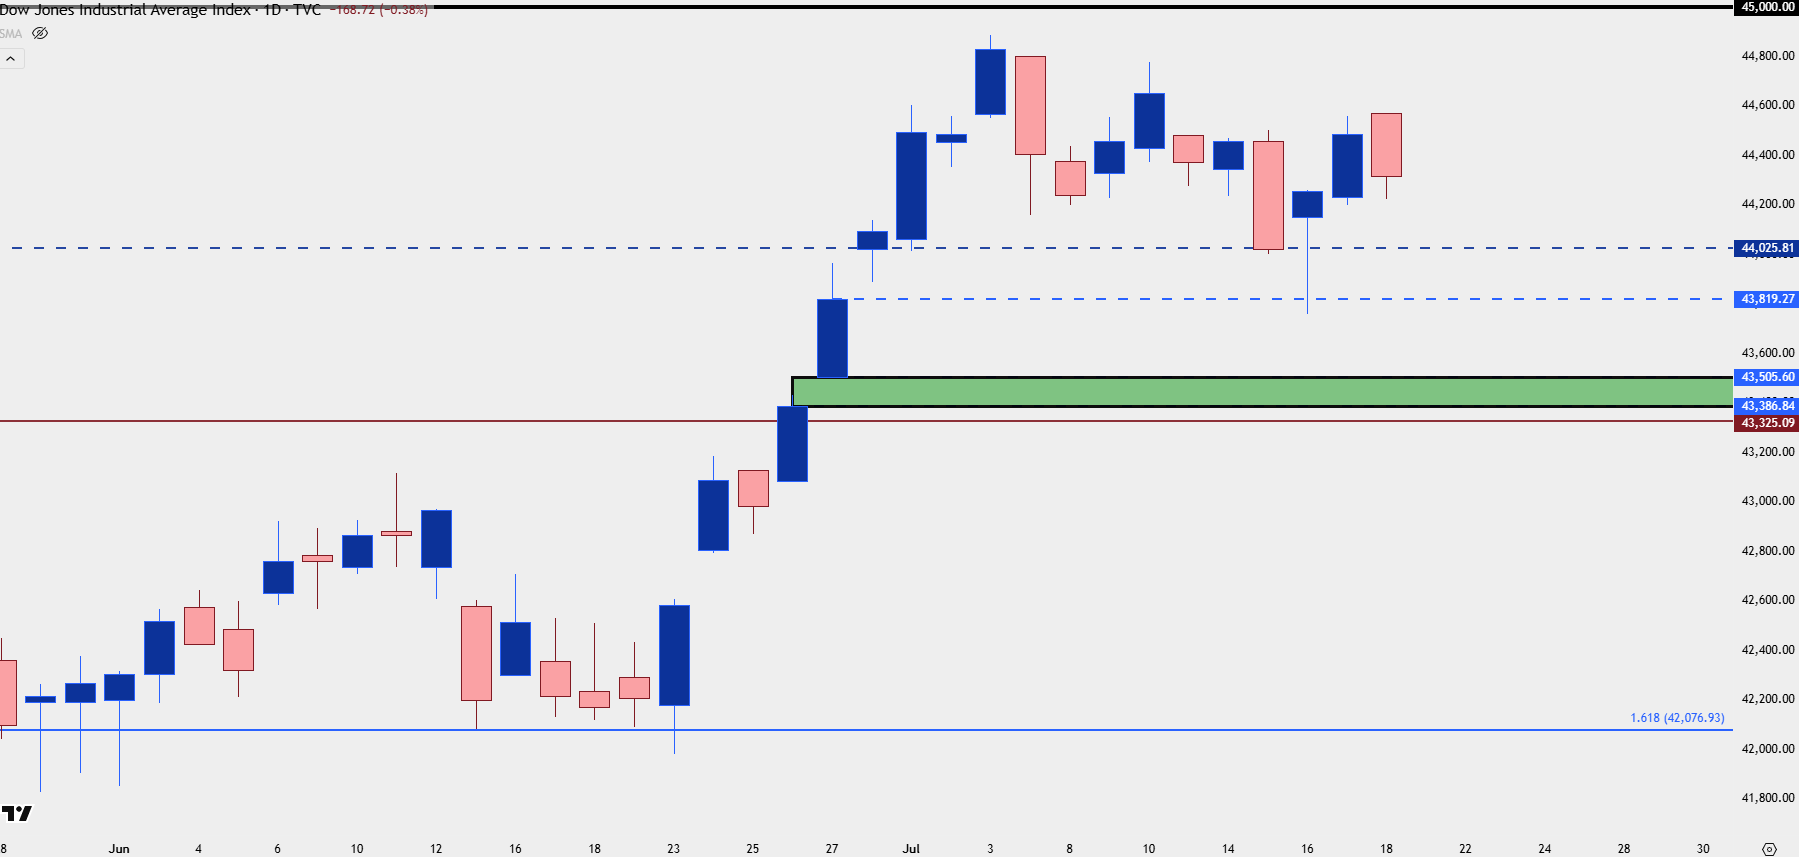
Chart prepared by James Stanley; data derived from Tradingview
— written by James Stanley, Senior Strategist
https://www.forex.com/en-us/news-and-analysis/sandp-500-nasdaq-dow-forecast-for-the-week-ahead/
The information on this web site is not targeted at the general public of any particular country. It is not intended for distribution to residents in any country where such distribution or use would contravene any local law or regulatory requirement. The information and opinions in this report are for general information use only and are not intended as an offer or solicitation with respect to the purchase or sale of any currency or CFD contract. All opinions and information contained in this report are subject to change without notice. This report has been prepared without regard to the specific investment objectives, financial situation and needs of any particular recipient. Any references to historical price movements or levels is informational based on our analysis and we do not represent or warranty that any such movements or levels are likely to reoccur in the future. While the information contained herein was obtained from sources believed to be reliable, author does not guarantee its accuracy or completeness, nor does author assume any liability for any direct, indirect or consequential loss that may result from the reliance by any person upon any such information or opinions.
Futures, Options on Futures, Foreign Exchange and other leveraged products involves significant risk of loss and is not suitable for all investors. Losses can exceed your deposits. Increasing leverage increases risk. Spot Gold and Silver contracts are not subject to regulation under the U.S. Commodity Exchange Act. Contracts for Difference (CFDs) are not available for US residents. Before deciding to trade forex, commodity futures, or digital assets, you should carefully consider your financial objectives, level of experience and risk appetite. Any opinions, news, research, analyses, prices or other information contained herein is intended as general information about the subject matter covered and is provided with the understanding that we do not provide any investment, legal, or tax advice. You should consult with appropriate counsel or other advisors on all investment, legal, or tax matters. References to FOREX.com or GAIN Capital refer to StoneX Group Inc. and its subsidiaries. Please read Characteristics and Risks of Standardized Options.