The economic and fundamental data is pretty discouraging. However, despite the “bearish” backdrop, the market has rallied hard on optimism of getting the country “re-opened,” but, in actually as stated above, more so from the “Pavlov’s response” to the ringing of the Fed’s “liquidity bell.”
Currently, the market has rallied back to my “target zone”.

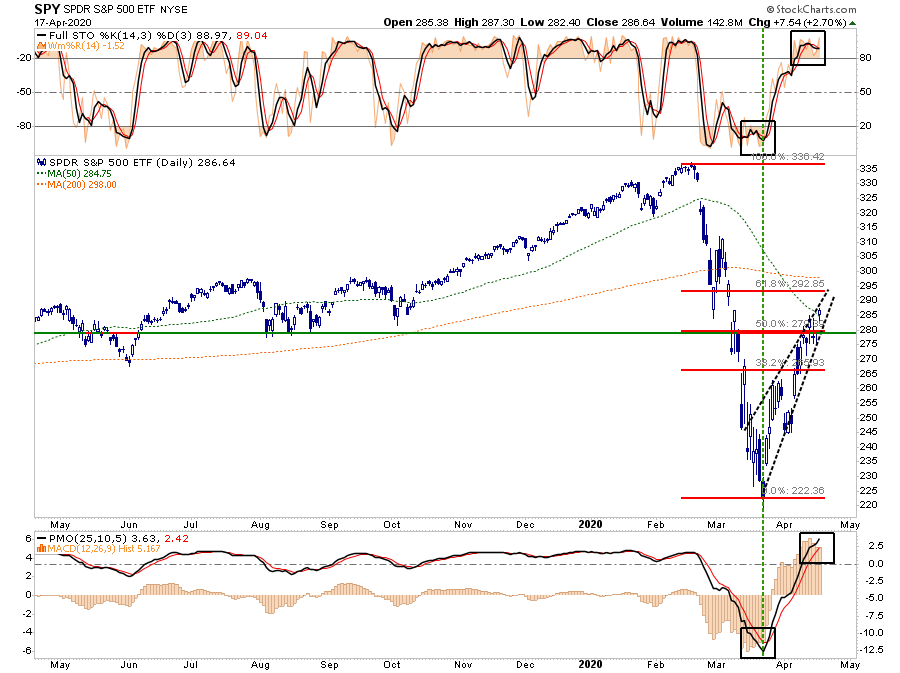
On a very short-term basis, the previous “deep oversold” condition that provided the “fuel” for the rally has been reversed.
On Friday, all primary “overbought/sold” indicators are now fully stretched back into overbought territory.
One of my ongoing concerns with the rally, has been the lack of participation and the “low volume” rally.
“In eight bear markets across the three indexes since the 90s, the bottom was usually marked with a bang, not a whimper. Trading volume in the first 10 days of the turnaround on all but one occasion (the Stoxx 600 in March 2009) was at least 10% higher than the volume in the bear market as a whole.
This year, all three indexes failed the test. The first 10 sessions after the local low saw average trading volume of ~98% the bear-market average for the S&P 500, ~94% for the Dow Jones and ~104% for the Stoxx 600.
Yet conviction was stronger on the way down than on the way up , and that’s a worrying sign. More study is needed, but on volume alone, this bear market doesn’t appear to be over.” – Eddie van der Walt via Bloomberg,
With the market overbought, this leaves more “sellers” who were trapped during the previous decline with a better opportunity to exit. This will particularly be the case as the data worsens over the weeks ahead.
If we look at our weekly indicators, the recent rally is much less “inspiring.” Both of the primary weekly “sell signals” remain intact suggesting the recent rally will fail. A failure from current levels would suggest a retest of the bullish trend line. (A failure of that trendline will set up a retest of the March 23rd lows.)

I know…I know. I’m being all *“bearish and **” by paying attention to “risk.”
So, here is your short-term “bullish” view.
If we set aside the fundamental and economic data for the moment, the short-term technical backdrop is indeed bullishly biased. The 50% retracement level was taken out on Friday, along with the 50-dma. (This is not a confirmed break unless it holds above those levels through next Friday.)

Friday’s close brings the 61.8% retracement level AND the 200-dma into focus as the next resistance levels. This suggests upside in the market of 4.5% to 7% currently. (Certainly nothing to sneeze at, considering such would normally be considered a decent year’s worth of returns. That just shows how skewed things are currently.)
The downside risk ranges are a bit more disappointing.
- -4.7% to the previous 50% retracement level: risk/reward equally balanced.
- -12.5% to the previous higher low: risk/reward is mildly out of favor.
- -20.5% to the March 23rd low: risk/reward extremely out of favor.
From an optimistic view, a reopening of the economy, a virus vaccine, and an immediate return to low single-digit unemployment rates would greatly expand the bullish ranges for the market.
However, even a cursory review of the data suggests a more “realistic” view. The economic damage is going to be with us for a while, and until earnings estimates are revised substantially lower to reflect the “actual economy,” I have to presume the relevant risks outweigh the current reward.
