Banco Santander is the largest bank in Spain and the 5th largest bank in Europe. Traded under ticker $SAN at BMAD and NYSE, it is a component of the EuroStoxx50 and IBEX35 market indices. In particular, the weighting of 15% in the IBEX35 makes Santander the component to watch in strongly correlated markets. Indeed, IBEX35 is the index which shows an incomplete pattern to the downside in the long-term perspective. That fact may be responsible for withholding the major world indices to rally. Hereby, the heavy-weight Santander may provide a clue to understand the structure of the consolidation pattern and the levels to be achieved before an uptrend can be finally resumed. Therefore, Santander can provide the timing for the rally in the IBEX35 and probably all other indices as well.
Santander Monthly Elliott Wave Analysis 06.22.2020
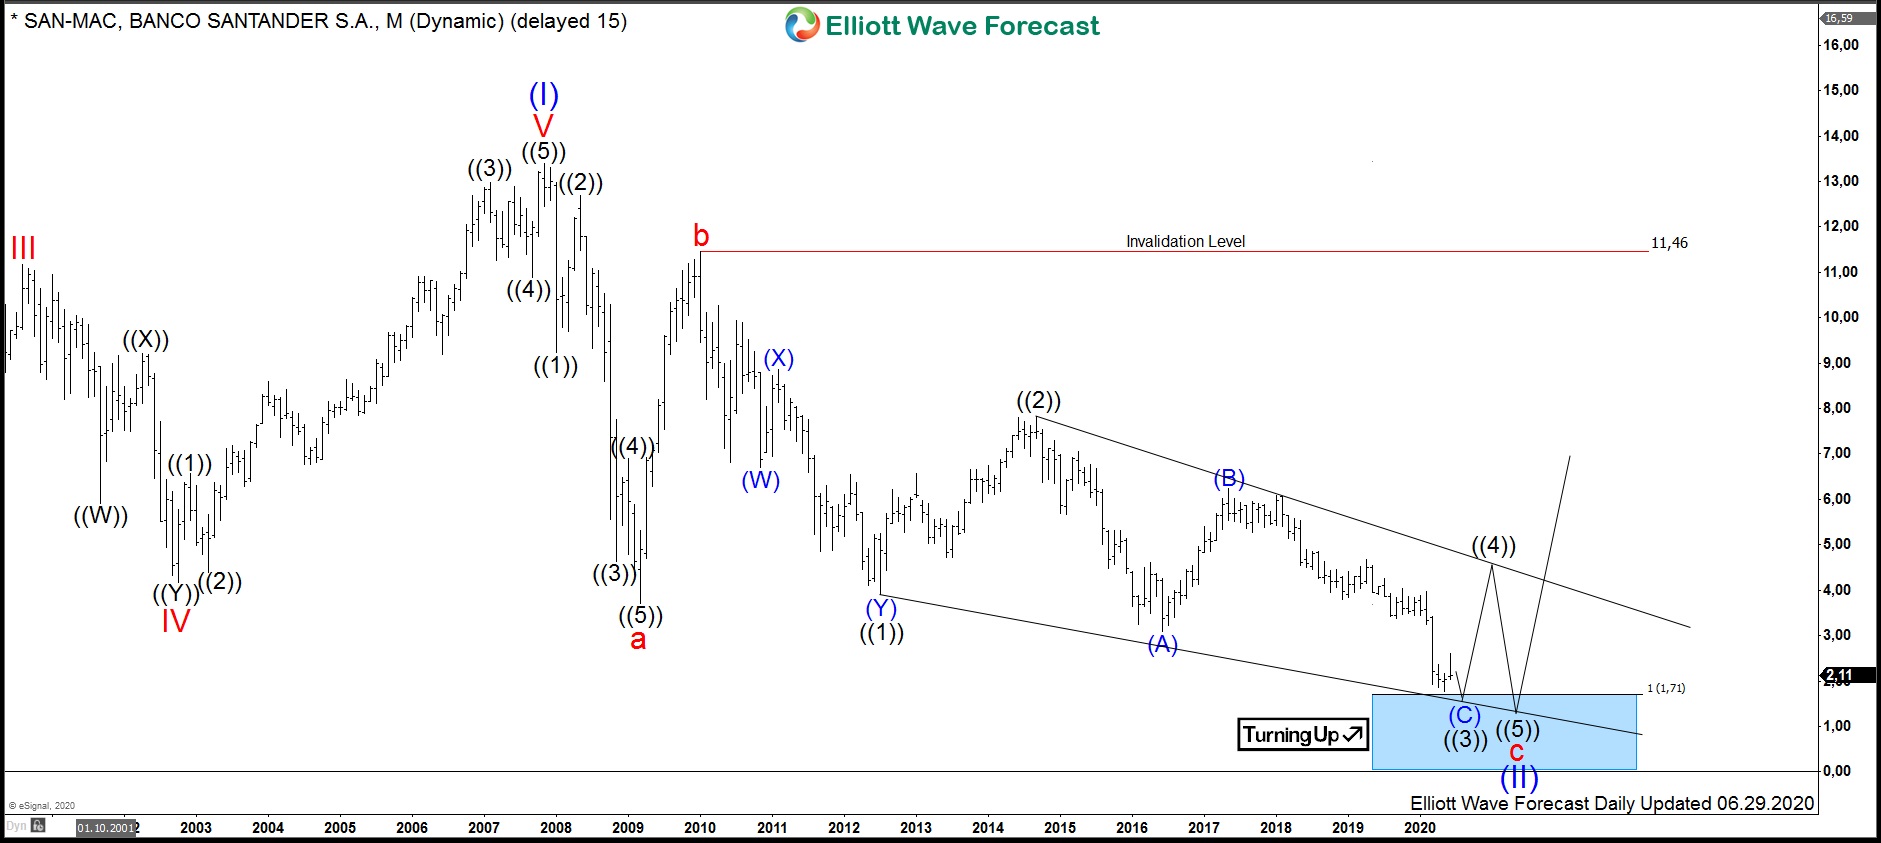
The monthly chart below shows the Santander stock $SAN traded at BMAD. From the lows, the stock price has developed a cycle higher in wave (I) of a super cycle degree. Santander has printed the all-time highs on November 2007 at 13.43. From there, a correction lower in wave (II) has started with a first leg unfolding as an impulse. The 5 subwaves of the impulsive decline in red wave a have ended on March 2009 at 3.67. From the lows, a bounce in red wave b has retraced a large part of the decline. It has ended on January 2010 at 11.44. Now, 5 waves lower and 3 waves higher may be a hint that the consolidation pattern might be unfolding as a zigzag pattern being 5-3-5 structure. As a consequence, one may expect another 5 waves of red wave c to extend lower from the January 2010 peak.
View of the decline, as matter of fact, provides a case of an overlapping structure. Only the break of the March 2009 lows has proven that the leg lower in the red wave c is in progress opening up the monthly bearish sequence against the 2010 highs related to the 2007 highs. The equal legs extension area towards 1.71 and lower should become the target for the wave c of (II) to end. Once that area is achieved, the rally in wave (III) to the all-time highs towards 13.43 and higher can resume.
Technically speaking, wave c unfolds so far as an ending diagonal which is an Elliott Wave 3-3-3-3-3 structure. Wave ((1)) has demonstrated a double three pattern which has found its bottom on July 2012 at 3.93. Wave ((2)) in 3 swings higher has ended at 7.83. From there, on September 2014, wave ((3)) has started an extension lower.
Santander Weekly Elliott Wave Analysis 06.22.2020
The weekly chart below shows the subdivisions of the wave ((3)) of the ending diagnonal in wave c. Hereby, wave ((3)) unfolds as a zigzag pattern. Waves (A) and (B) have been accomplished. The market has confirmed being in the wave © lower by breaking the June 2016 lows at 3.05. Based on the equal legs extension of the wave © related to the wave (A), Santander may now achieve 1.48-0.39 area. Thereafter, bounce in 3 waves in wave ((4)) should fail below September 2014 highs at 7.83. Ideally, Santander should drop from below the monthly resistance line for the last push lower in the wave ((5)). The final decline should unfold 3 subwaves. It may retest the lows or even do a marginal new low within the monthly blue box area.
As a consequence, the complete pattern along with achievement of the monthly extension area and the lack of space to the downside may become the end of the syper cycle wave (II). After all, Santander is expected to extend from the monthly blue box area higher in the wave (III) towards 13.43 and higher.
