USD/Huf showing profits.

1 Like
Yea, I got the indicator, was just trying to see what the code looks like to find something similar on TV. No big deal. Thanks!
@AmericanTrader How are you approaching JPY pairs with all the monetary policy change talk going on? Any changes?
I’m just doing pending orders based on weekly charts since last week. Yesterday morning was extremely profitable. Mostly from CAD longs and my money printing USD/Huf longs.
I just checked and I have no pending orders on jpy pairs. Which is kind of amazing since Japan officially entered recession. I don’t see any need to get in on them any time before a trend develops from the policy changes.
Btw: I review my pending orders daily and deleted 3 of them yesterday because the other 5 I left open look more promising. Sticking with high probability only.
Cool. Thanks for the details. Always glad to learn the day to day trading operations.
All of my previous weekly chart trades except the Eur/Usd long were profitable.
My current W1 trades (pending).
Fingers crossed as always:
Eur/Usd

Here is it on monthly chart:

UsdHuf

NZD/CAD

AUD/USD

Aud/CAD

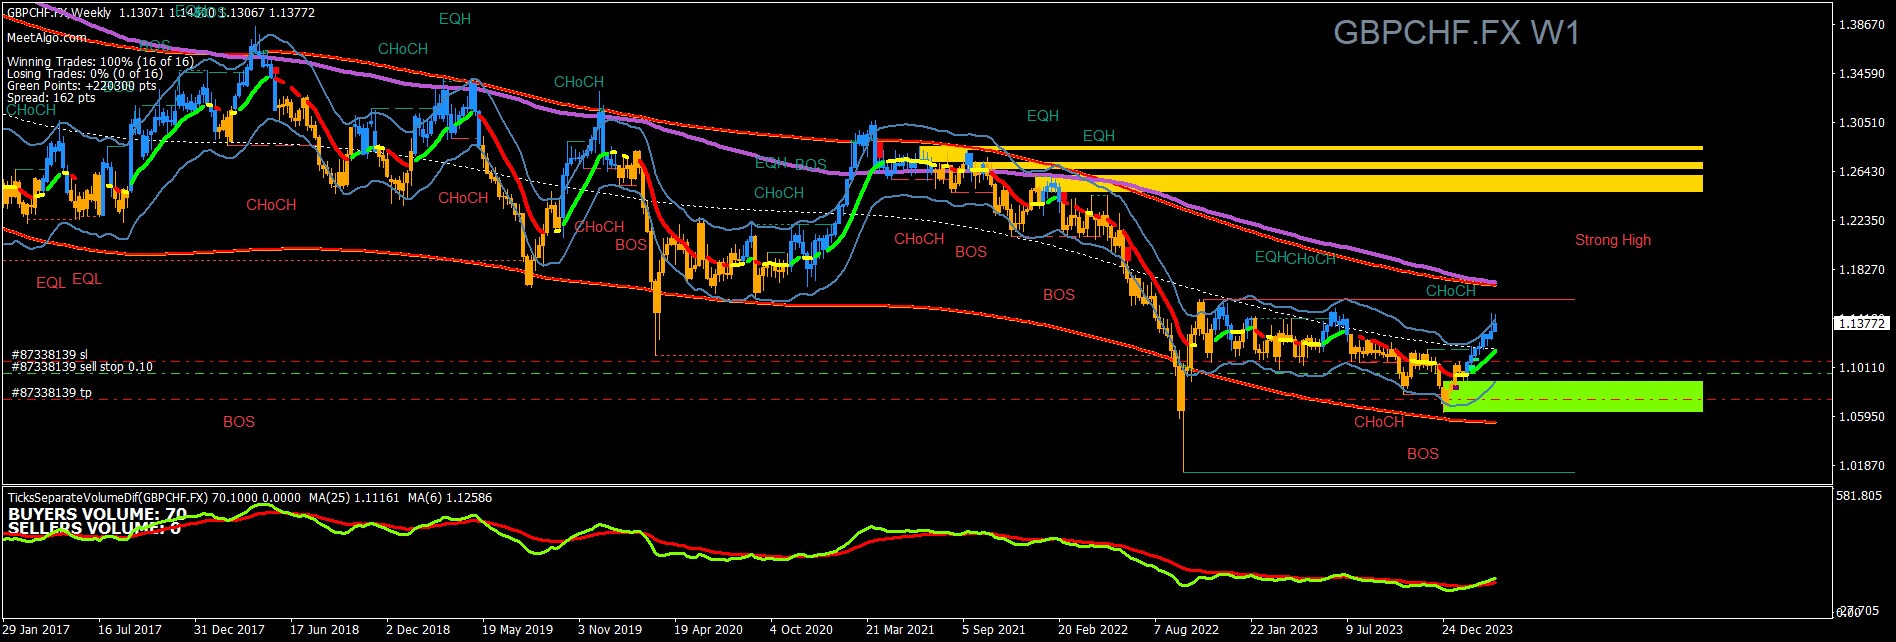
GBP/CHF
NZD/JPY

1 Like
How are your trades holding up? Yen still doing the opposite of what I’m hoping. How long can it last?!?
Just caught some great moves on the 1m and 5m on GBPJPY.
Is the Yen coming around? 240 pip move over the last 12 hours.
Nice!
Hey @AmericanTrader, question, how do you think your shorter term scalps are performaning compared to your swing and longer term trades?
I moved off the ltf trades a bit and my account has suffered in the short term. I also traded more outside of the majors, so I think that’s playing into it too.
How about you?
Well, I just had the best week of the year so far and it’s all been on those weekly chart trades. After being down 2 days ago the cumulative 570 Pips, only one of them is still negative, about 79 pips. The ones that were profitable brought me hundreds of pips. So I only have one trade open now. The one that just not in profit yet. The anticipation is 200 Pips profit when it is finished.
I have also entered pending orders on the pairs I closed out yesterday today in anticipation of at least a daily pullback.
So I have a pending sell order at euro/USD and pending buy order on usd/Huf. The Huf has stop loss of about 700 Pips as there could be a weekly pull back sometime soon.
Until those pending orders hit, I hope to find the time to sit on my couch and do a little scalping. I earned similar amounts whether I am scalping or swinging, but the swinging on the weekly charts allows me to not worry and stress over the trades everyday.
1 Like
Long, boring post below:
I learned something years ago about trying to anticipate trends based on the news or common knowledge of events going on. I learned that although a long-term trend could be coming, I was always wrong about when the trend would start. Trends that logically seemed like they should start right away didn’t start until months later. Sometimes after those months I found that I missed out on so many opportunities waiting for the expected trend. So I still go by what I see on the charts.
I’m developing another theory these days. I’m sure someone thought of this long ago but here it is. After a trend starts and has one pull back but continues on in the trend direction after that - the odds are very strong that there will be another pullback and then it will continue on in the trend direction. However, after a third pullback, I don’t think there is as high a probability that the trend will continue. So for daily and weekly charts, I think the win rate is extremely, extremely high after that second fullback and 50/50 after the 3rd. We don’t have to wait for the setup to do anything. We just have to have this be something we look for when we go over the charts every week. Then jump on it when the opportunity presents itself.
It’s going to be a difficult rest of the month. I did set a monthly goal for each month this year and I met the goal last thursday. So I don’t want to take a chance of now losing a trade before the end of the month.
I’m left with my pending orders see if they get hit this month or not. Other than that, I guess no more trading until May ![]()
![]()
![]()
Could you do a yt video or a recording how exactly you use the strategy? I find it difficult to understand it, really… ![]()
![]()
Noice! A bit early! Ha. Congrats on the success. Jan and Feb were positive. Then Mar I reading waaaaay to much crypto stuff and trading. Lost my groove. Down about 50% of the gains made in Jan + Feb. Down lover 100% of Febs gains. This month, back to more short term trades, up 4.25%, 2.4% for the week.
1 Like
Hi priceactionDan!
Hope all is well with you and sorry to take so long to get back to you.
I don’t do any videos. I’m not even set up for it. All of my recent trades have been on the weekly chart so videos for them would be difficult anyway.
Are you on tradingview or mt4?
Since I am on mt4, all of the recent screenshot strategy examples show mt4 indicators.
Maybe when some of my open trades on those long-term charts close I’ll have a chance to go back to some of those mornings where we trade on the m1 and M5 charts together during the London session.
I am also trading on MT5 so I understand but I do not have the basics, when to take the trade, where to set SL, etc… it is confusing just following the threads (I also have ADHD so my attention spam is all over the place). I learn fast but if someone would show me exactly what is what…

Best long trade entry is when Green price is near or below lower CAP Channel line. Enter when Green 7EMA crosses over lower Red 25EMA.
Set SL below lower Red. I would set it below the Purple 200ema in this example.
When price reaches the Gray Cap Mid point line - move SL to at least break even. You are looking to close the trade at the mid point line, or moving your SL to a profit (Perhaps over the upper Red 25EMA). Then keeping the trade running to see if price reaches the upper CAP Channel line and then closing.
Of course, you can always choose to continue locking in more profit if price should go above the upper Cap Channel line if you want to. but the whole point is that there will be a few opportunities each day on a high volume pair, most likely a USD pair.
I suggest only trading this way during London and early NY sessions. If possible, either close any trades opened during London before the high impact news of 8:30am New York time, be sure your SL is set to break even or profit by that time.
Using the strategy this way keeps any losing trade at a very small loss. If you want to take the trading to a more advance level, I like a wiiiiiiiiiiiiiide SL and to cost average entries if price goes against you. The cost averaging method is used in all of the King of Forex videos on YT.
2 Likes
Last night was awesome and this morning was awesome.
Last night, nzd/cad I closed out some profits and then set a new pending order assuming a pullback, which happened overnight. Same with aud/usd.
Closed out both and I now have three open trades that looks like they’re going to next week or beyond.
Anticipation on open trades is a cumulative 600 to 800 pips.
1 Like
Step, find all the indicators and see if they exist on MT5.
Using the Envelopes indicator on D1 charts.

The double white lines are Envelopes set to 14 simple.

The blue double lines are Envelopes set to 100 smoothed.

Close up of the white 14 simple Envelopes on weekly.
