AMC Entertainment Holdings, Inc. is an American movie theater chain headquartered in Leawood, Kansas, and the largest movie theater chain in the world. Founded in 1920, AMC has the largest share of the U.S. theater market ahead of Regal and Cinemark Theatres. It has 2,866 screens in 358 theatres in Europe and 7,967 screens in 620 theatres in the United States.
AMC Daily Log Chart December 2023
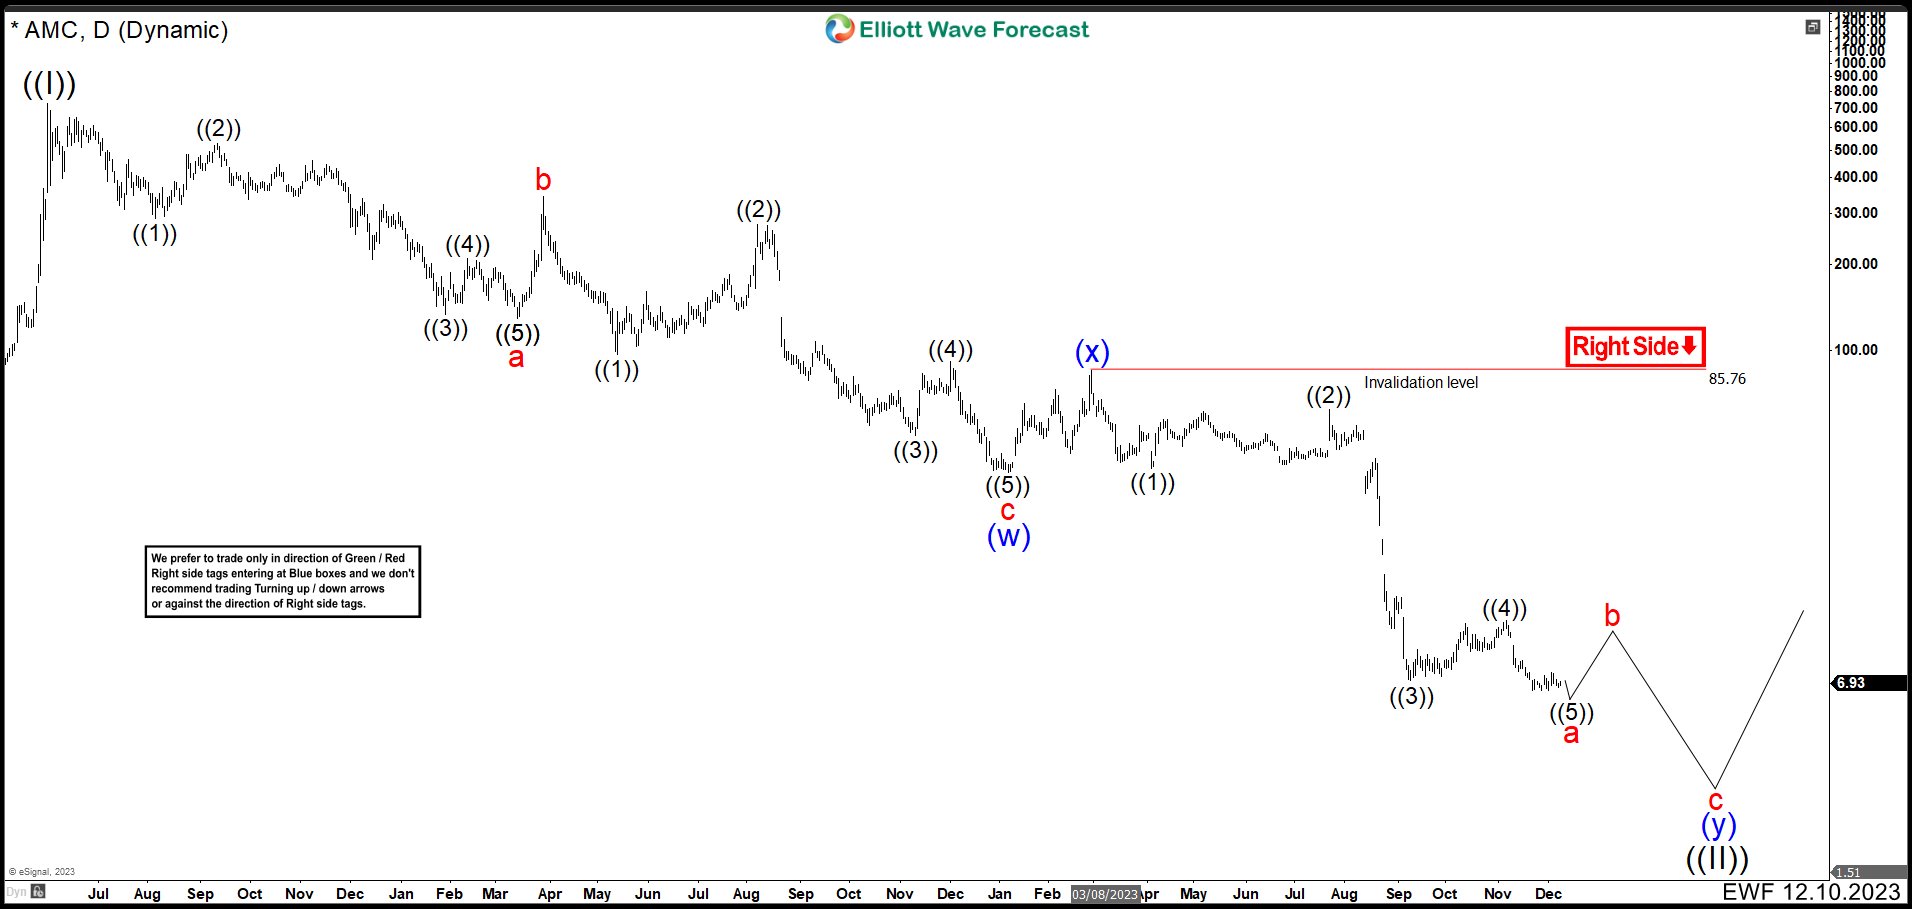
AMC ended a Grand Super Cycle in June 2021. The share price has fallen from more than 700 dollars to only 7. In order to analyze the possible structure of Elliott we have transformed the chart to a logarithmic chart. The structure from the peak looks very clear, we have groups of bearish impulses connected by corrections. It is for this reason that a double correction structure is the best alternative for AMC’s decline.
Down from the 2021 peak, we can see an impulse that finished wave “a” at 129.00 low. The correction of this cycle ended a wave “b” at 343.30 high and then continued a new downward impulse. This impulse completed wave “c” at 37.70 low, and thus, the first part of the double correction structure as (w). Then connector wave (x) was shallow ending at 85.30 high. Then the downward trend continued, having a strong bearish momentum in the month of August. We can clearly see another bearish impulse from the high of 85.30. Near term, it looks like to complete wave “a” of (y) we need to break below 6.53. Then any rebound that passes above 7.54 could confirm that wave “a” ended and we would already be in wave “b”.
Although we have drawn wave “b” somewhat short, wave “b” can move between 85.30 and the end of wave “a”. As the fall has been very violent, it is likely that wave “b” will be small. To finish, we need a “c” wave of (y). In this way we would finish the structure of the double correction wave ((II)) and we should look for a new rally in the stock. Actually, it is not possible to know some area where wave ((II)) could complete the cycle.
