Sharing My Secret Trend Reversal Strategy with an 80% Win Rate

Hello, I am sharing my strategy, which I am using for manual trading, and I am planning to build an EA based on this strategy soon. This strategy works for all currency pairs and timeframes, but the recommended timeframes are M1, M5, M15, and M30.

This strategy is currently giving me an 80% win rate, tested for almost three months. However, I am still experiencing minimal losses because a single losing trade wipes out the profits from 10 winning trades. I am in loss not because of my technical analysis settings but due to poor money management, risk management, and risk-to-reward ratio.

In this strategy, we use the RSI, Bollinger Bands, and Moving Average indicators:

  • RSI is used to identify overbought/oversold conditions.
  • Bollinger Bands help determine resistance/support levels.
  • Moving Averages are used to identify trend direction.

Sell Trade Setup:

  1. RSI (Period 14) > 80 → Overbought condition.
  2. Current market price touches the Bollinger Bands (Period 30, Deviation 2) Upper Band/Resistance Line.
  3. Current market price is below the 200 EMA (Low Price).

If all three conditions are met, take a SELL trade.

Buy Trade Setup:

  1. RSI (Period 14) < 20 → Oversold condition.
  2. Current market price touches the Bollinger Bands (Period 30, Deviation 2) Lower Band/Support Line.
  3. Current market price is above the 200 EMA (High Price).

If all three conditions are met, take a BUY trade.

These settings provide very few signals per day—just 2-3 per currency pair.

Alternative Settings for More Signals

If you need more signals, you can adjust:

  • Bollinger Bands to Period 20, Deviation 2 (default settings).
  • 200 EMA based on Close Price instead of High/Low Price.

With these settings, you can get 5+ signals per day, but the win rate decreases to 70%.

Why Am I in Loss?

I set my Take Profit (TP) to 100 and Stop Loss (SL) to 500. With a lot size of 0.01, I make $1 per winning trade. However, even if I win 5 trades and lose 1, my losing trade wipes out all my profits.

Example:

  • 8 winning trades (0.01 lot, 100 TP) = $8 profit
  • 2 losing trades (0.01 lot, 500 SL) = $10 loss

Even with a high win rate, my poor risk management keeps me in loss. I tried lowering the SL, but that significantly reduced the win rate, leading to even more losses.

I am sharing this strategy so you can try it as well, provide feedback, and share any ideas, new settings, or money management strategies.

Thank you!

Updated :

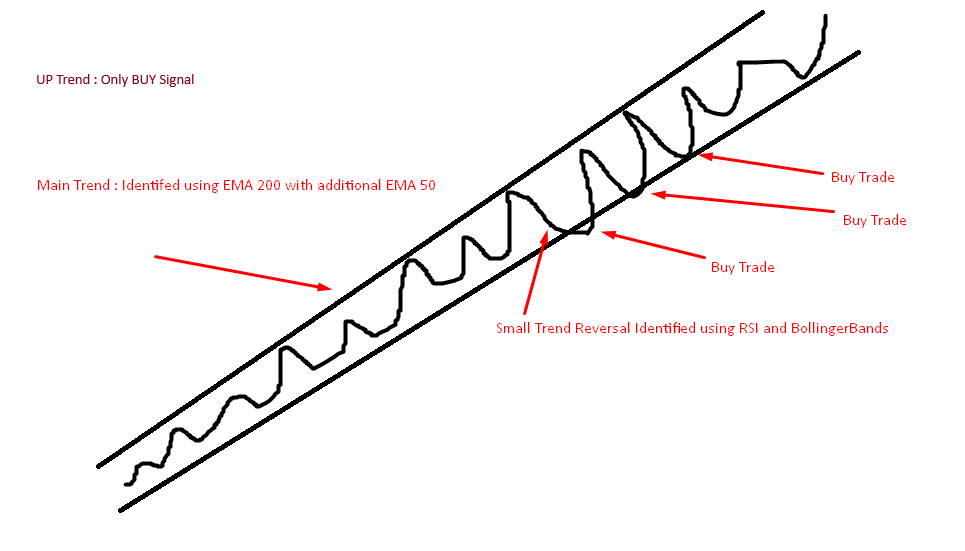
Many people have a misconception that I am going against the strong trend, but that is not true. If you have noticed my entry conditions for BUY and SELL, you will see that I only take BUY trades in an uptrend and SELL trades in a downtrend. I trade trend reversals for weaker or smaller trends. Additionally, I have started using the EMA 50 for better trend confirmation, along with the EMA 200.

Here is an illustration of how my trade entries work:

For BUY Signal :

For Sell Signal :

Not being rude, but why would you automate a strategy that you know is losing? That stop loss to tp ratio would have about an 80% win rate with a random entry method, so I really don’t see an edge here.

If I were you, I’d bin the indicators and look for better strategies based on price action. @tommor has posted a couple of good ones.

3 Likes

It’s “best advice,” for sure.

But unfortunately it’s not what the OP wants to hear. :slightly_frowning_face:

2 Likes

It’s the problem with this game, so much advice is from people losing money. Then you add these indicators to a chart, look back and see how great they are, but your eyes skip over the losing signals. Then you add caveats of why this signal failed and you wouldn’t take it for whatever reason, but calling that in real time without the rest of the chart isn’t possible.

The first thing I tried was trading structure, and it mostly worked. But I was ill disciplined and traded too big with no discipline which eventually lost big. So I went on a wild goose chase with indicators and all sorts. I’m now back where I started with a better understanding of how the market is moving. But the key to all of this is discipline. You need good rules in place to stop you from doing something stupid and if you can’t stick to them, find something else to spend your money on.

4 Likes

Can you highlight some of the post of him. I checked his problem but there is lot of post and replies by him. which one you referring?

Because EA can look for signal across multiple currency pair and timeframe. The strategy giving really good win rate but i am in loss by money. Maybe i am doing something wrong in Risk to reward.

Your stop loss is 5 times bigger than your tp. That means that assuming the market are random, you should win 5/6 trades and lose 1/6. You’re doing worse, which is why you lose money.

With that ratio, you need to win 90% of the time to have a meaningful system

2 Likes

Updated : In Original post, i made some mistake for entry of BUY and SELL trade. I just noticed now. I edited and updated my original post. Sorry for inconvenience.

Random trade does not give 90% win rate even when your SL is bigger than TP.

I agree, that my Risk management and Risk to reward is poor or worse. I am improving it. coming week i am going to test equal TP and SL. And will share the report how it perform.

I don’t think you understand probability. Random won’t give 90%, it’ll give 83.3% (slightly less because of spread). You can’t beat that, your system isn’t good enough. I’m trying to explain that indicators don’t work for entry signals, that’s not what they’re for, certainly not on forex and low time frames.

3 Likes

You mean to say, There is nothing special in my strategy? It have 80% win rate because of probabilities from StopLoss = 5xTakeProfit?

But i have analyzed back-data using this settings and i noticed whenever the condition is met, 80% time it move in favorable direction

I was writing a long post, last night, explaining patiently that you had everything back-to-front and had totally misunderstood how both RSI and BB work. Eventually I lost my own patience and gave up, and didn’t post.

I’m so pleased that was all a mistake, and you’ve changed it.

But you still have great problems, here.

The main problem is that you’ve learned to trade from online “information” and are full of widespread but deeply mistaken beliefs.

Finally. The truth. Read that sentence 500 times, @shanmugapradeep . Then read it another 500 times. Read it until it’s coming out of your ears.

That IS, actually, the main reason you’re in loss. Your system has no edge. Because its use of TA is nonsense. People in forums are really polite (and ill-informed) and they won’t tell you that. But it’s true.

All those things are also true, but they’re not the main reason you’re in loss. Your system has no edge. That’s the main reason you’re in loss.

“Overbought” and “oversold”, in this context, are nonsense.

No, they don’t!! That’s rubbish!! Resistance and support levels are shown by swings-high and swings-low of prices, not by indicators!!

Why are you trying to automate something that doesn’t work?! That’s crazy! What are you interested in, trading profitably or automation?! Nearly all the threads you’ve started here over the last 4+ years (85 of them) tell me the answer’s “automation”. Hence your problems.

So what? But how far? And how much do the losses cost?

John is right.

You’re trying to learn from all the wrong sources, Shanmugapradeep. This is why it’s so terribly difficult to help you. :worried:

Exactly. THAT’S what you need to know, Shanmugapradeep.

Indicators are not entry signals.

Indicators aren’t good for forex anyway.

Indicators were almost all designed for stocks, and for daily charts.

4 Likes

Thanks for your explanation and feedback.

Can you explain more about this?

1 Like

It’s just what the words “support” and “resistance” mean.

“Support” is where the price went down to, but no further down: it’s the price-level at which there was enough buying pressure for the price to subside no further. “Resistance” is where the price went up to, but no further up: it’s the price-level at which there was enough selling pressure for the price to rise no further.

You see where they were by looking at PRICES, not at INDICATORS.

It’s as simple as that. :sunglasses:

I didn’t mean to sound critical. Sorry if I did. I’m trying to help.

I want to avoid a situation in which you’re still here after another 4 years and another 85 threads and still believing the same things you believe now, and still trying to use EA’s and to automate, and still looking at online “information” rather than reading some proper books.

You’re persistent, anyway, and that’s a good thing. Most people struggling as much as you and for as long as you would have given up by now! :grin:

3 Likes

What you said is simple and clear, but the action to identify support and resistance is confusing for me.

I understand that you mean indicators are not that helpful. But as you mentioned, by looking at the price, I will get to know about support and resistance. The big question is: HOW? What kind of pattern should I look for? What kind of timeframe should I choose? Forex has no volume information (not lot size volume) like the stock market, which shows real volume for buy and sell orders in real-time. So, how can I know what support and resistance are by just looking at the price and chart?

Please provide a demo (maybe a screenshot, video, or explained text) that is helpful. At what condition or pattern should I consider it might be support or resistance?

“Support & Resistance Levels”

4 Likes

If you can’t identify structure confidently, then look at other simple techniques. Something like a pending order at the low of the previous candle in an uptrend. Do that on the daily chart, use the previous candle’s size as your SL, every day move your SL up to 2 day’s before low and ride it until you have a day that doesn’t make a new high.

Think of ideas like this and back test them. Also, I’d look at indices rather than forex. They’re more predictable imo and have an in built bias towards moving up, so you have an edge by developing strategies to go long.

2 Likes

Are you sure? It still doesn’t read right for me…

For my own clarity, you are saying that if you take random entries and set 5:1 SLs:TPs your win rate would be 5/6? 3:2 would give you 3/5, 2:7 would give you 2/9, etc.?

(And this assumes no overarching bullish or bearish bias correct? Or is the theory/principle behind this somehow trend-agnostic?)

The final implication being:

You need a strategy with a positive gap between the win rate and R:R (SL/TP) profile to have an edge.

Did I get this right?

So:

  • A 87.5% win rate would give that 5:1 stop loss a ~5% edge
  • A 65% win rate would give that 3:2 a 5% edge
  • A 50% win rate would give that 2:7 a ~27% edge

Yes?

Basically, if your win rate and R:R (PF) are inverses, it proves your setup produces basically random results and you have no edge.

Without looking at anything else, the fact that @shanmugapradeep’s win rate is slightly below what his R:R requires, suggests that his setup probably produces random results that he is slightly underperforming.

Correct?

Small Typo mistake. I corrected it.

1 Like