This blog provides an Elliott Wave update to our previous blog here --> Shopify (NYSE: SHOP) Wave V in progress Shopify has extended higher to end wave III as the previous blog suggests. Now it is in wave IV correction and still has chance to extend higher again later.
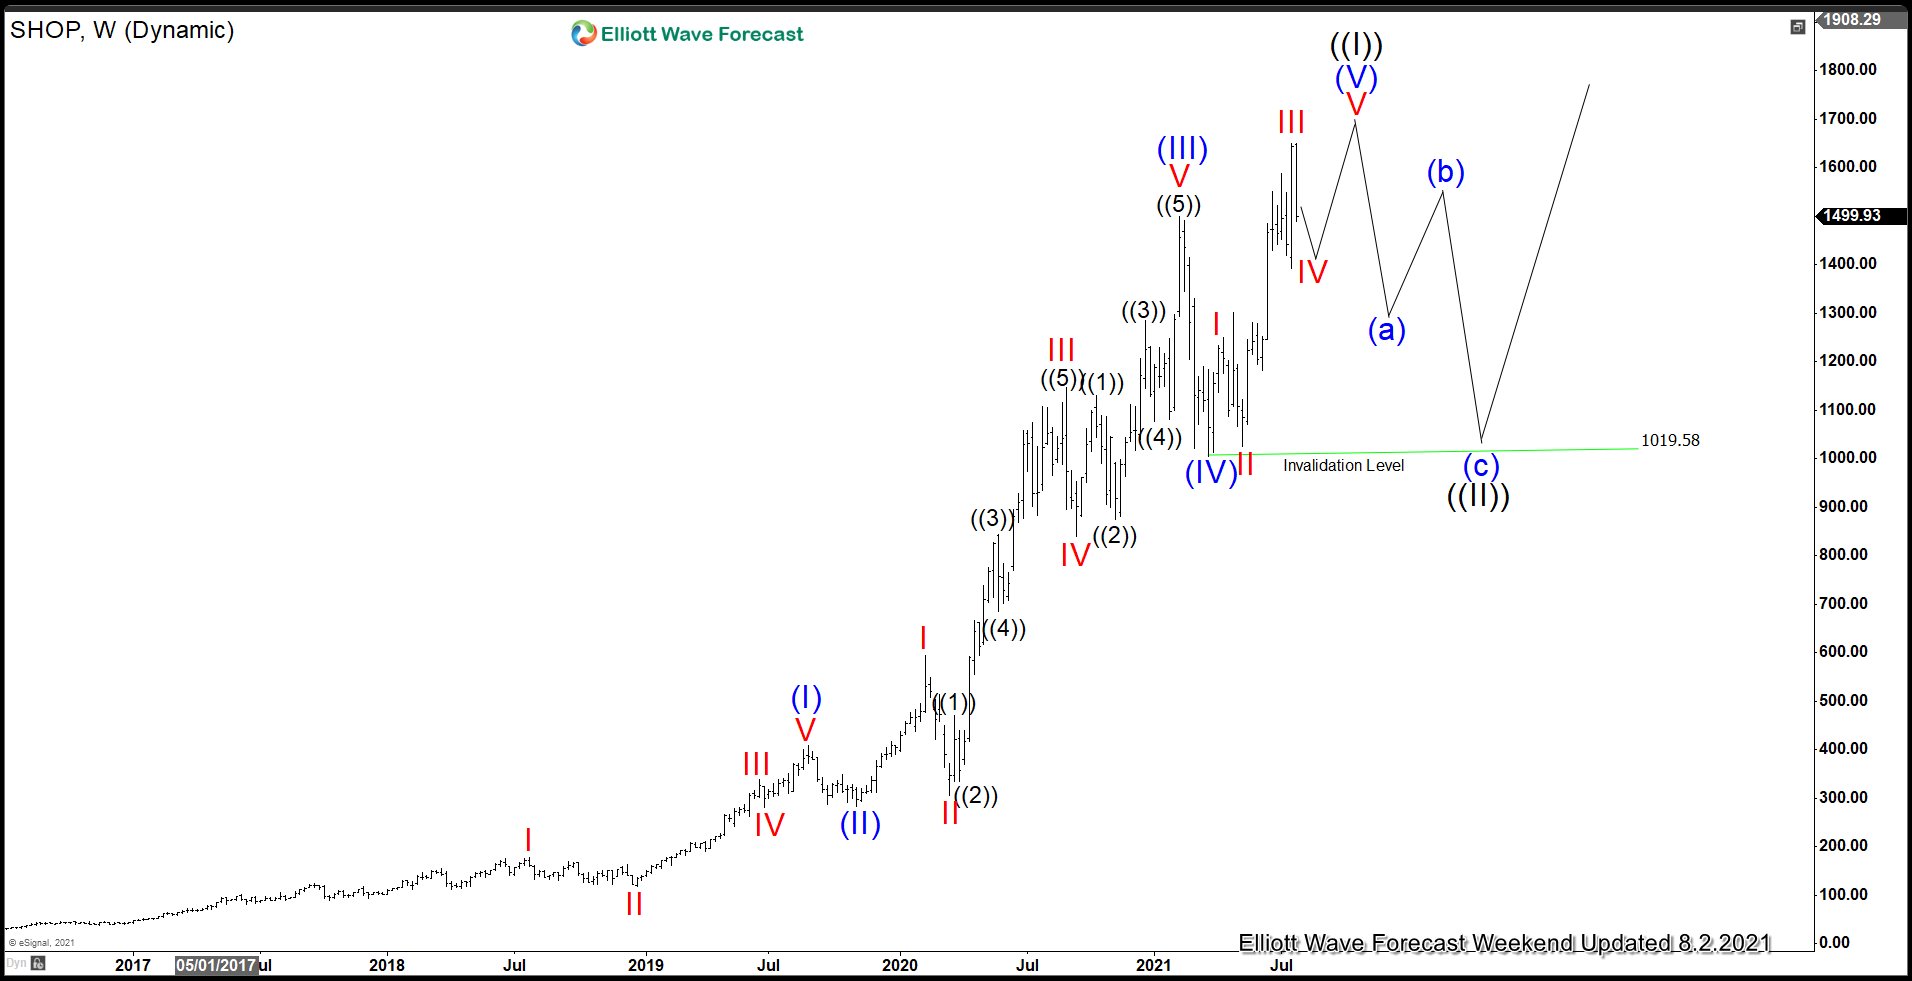
SHOP Weekly Chart August 2, 2021
Weekly Chart of Shopify above shows that the stock continues to make all-time high and currently looking for wave IV of (V) pullback. Potential target for wave IV is 23.6 - 50% fibonacci retracement of wave III at 1339 - 1500. It has currently pulled back to 23.6% Fibonacci retracement but short term can still see further extension lower before ending wave IV. Afterwards, the stock has scope to extend 1 more leg higher to complete wave V of (V). This should also complete wave ((I)) and end cycle from all-time low. Stock should then correct in a large wave ((II)) pullback to correct the entire rally from all-time low in 3, 7, or 11 swing.
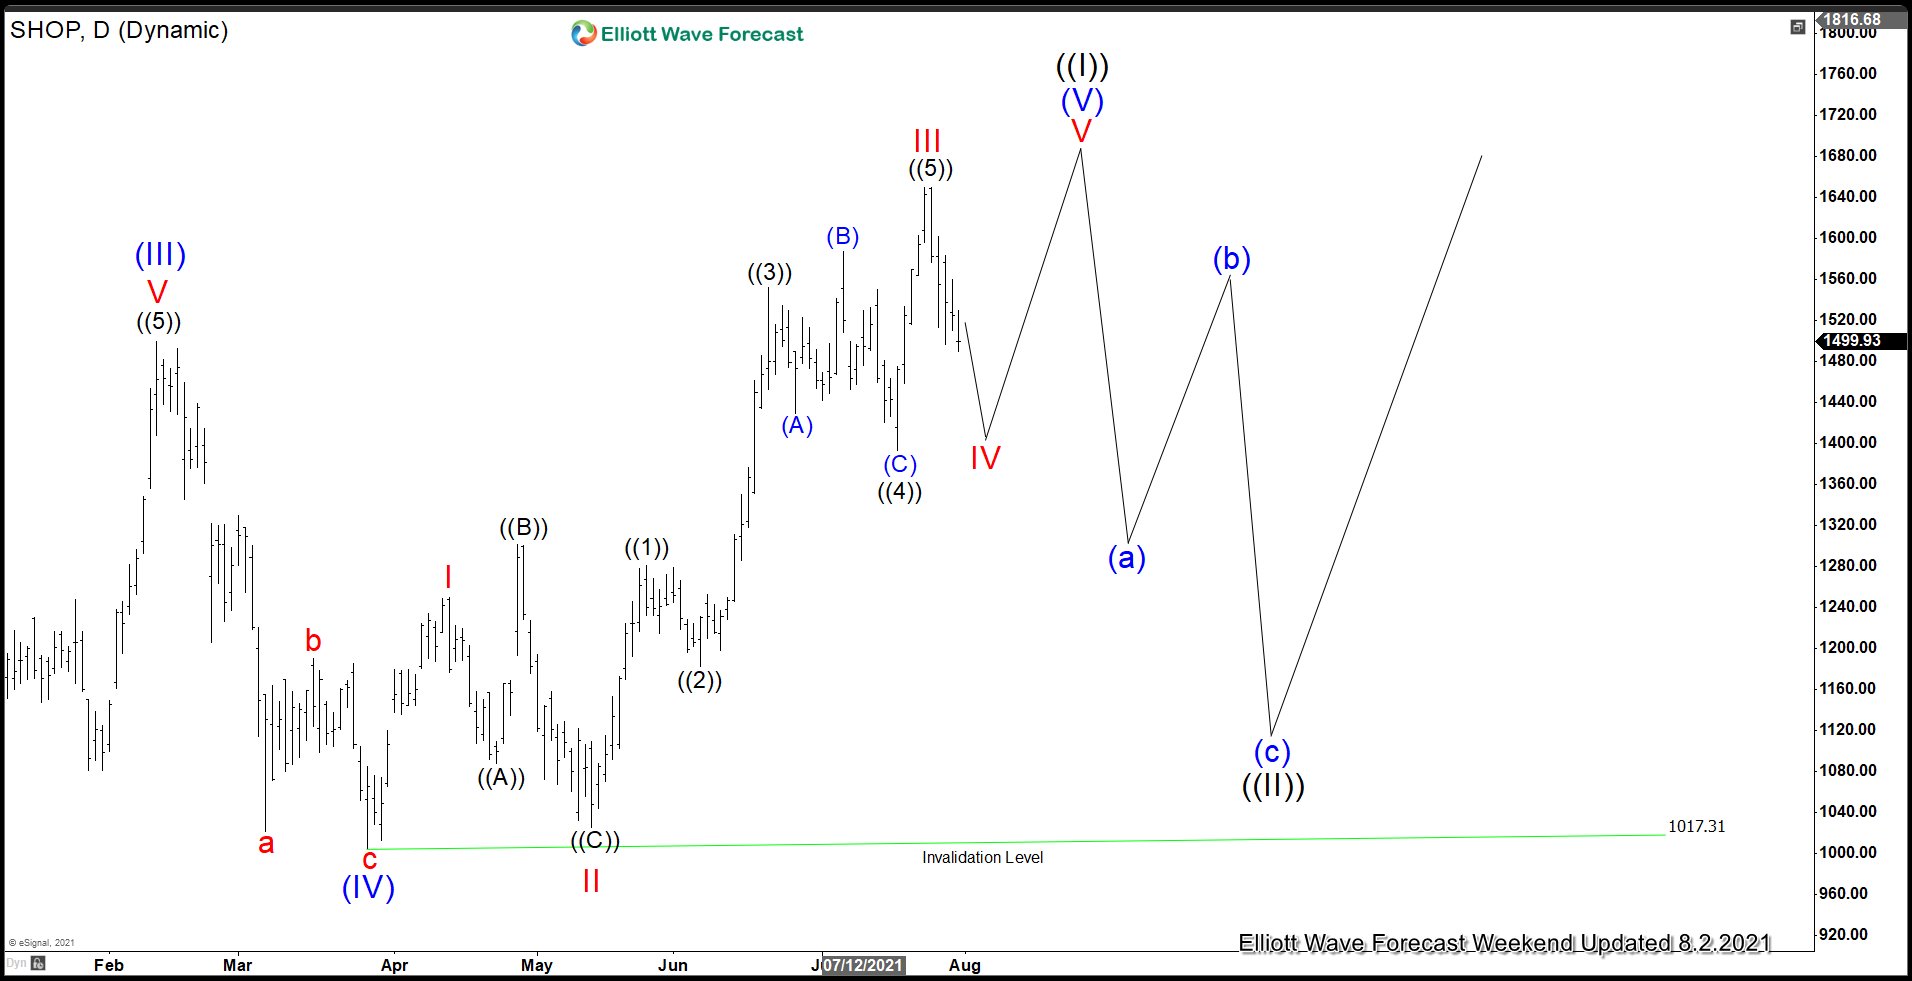
SHOP Daily Chart August 2, 2021
The Daily Elliott Wave chart of Shopify above shows wave IV in progress to correct cycle from May 13 low. The pullback should unfold in 3, 7, or 11 swing with 1 more possible push higher. As far as pivot at 1017.31 low stays intact, expect dips to find buyers for further upside.
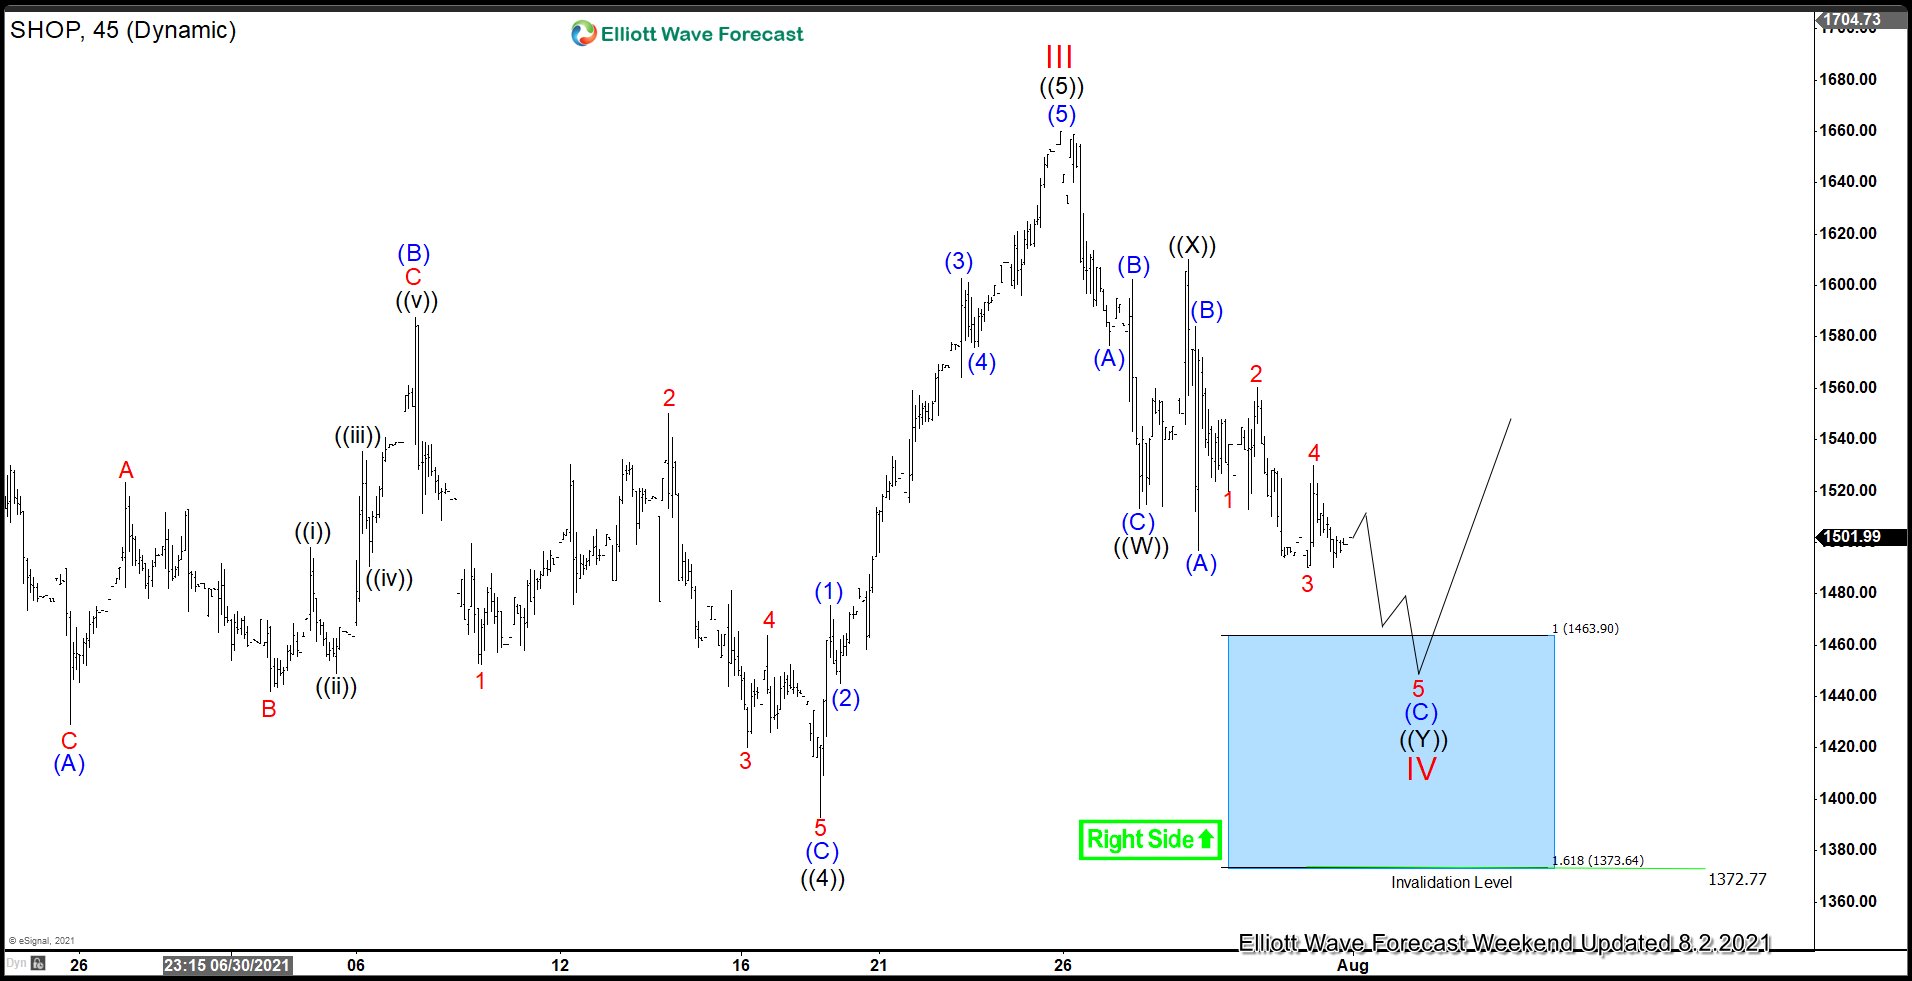
SHOP 1 Hour Chart August 2, 2021
1 hour Elliott Wave Chart for Shopify above shows that wave IV pullback is in progress as a double three Elliott Wave structure. Down from wave III, wave ((W)) ended at 1513.04 and bounce in wave ((X)) ended at 1610. Wave ((Y)) lower is in progress as a zigzag and can see further downside to reach 1373 - 1463 area. Buyers can appear from this blue box area for more upside or 3 waves rally at least.


