The Indian rupee (USDINR) is the official currency of India. The rupee is subdivided into 100 paise (singular: paisa), though as of 2022, coins of denomination of 1 rupee are the lowest value in use whereas 2000 rupees is the highest.
Quarterly USDINR Log Chart December 2022
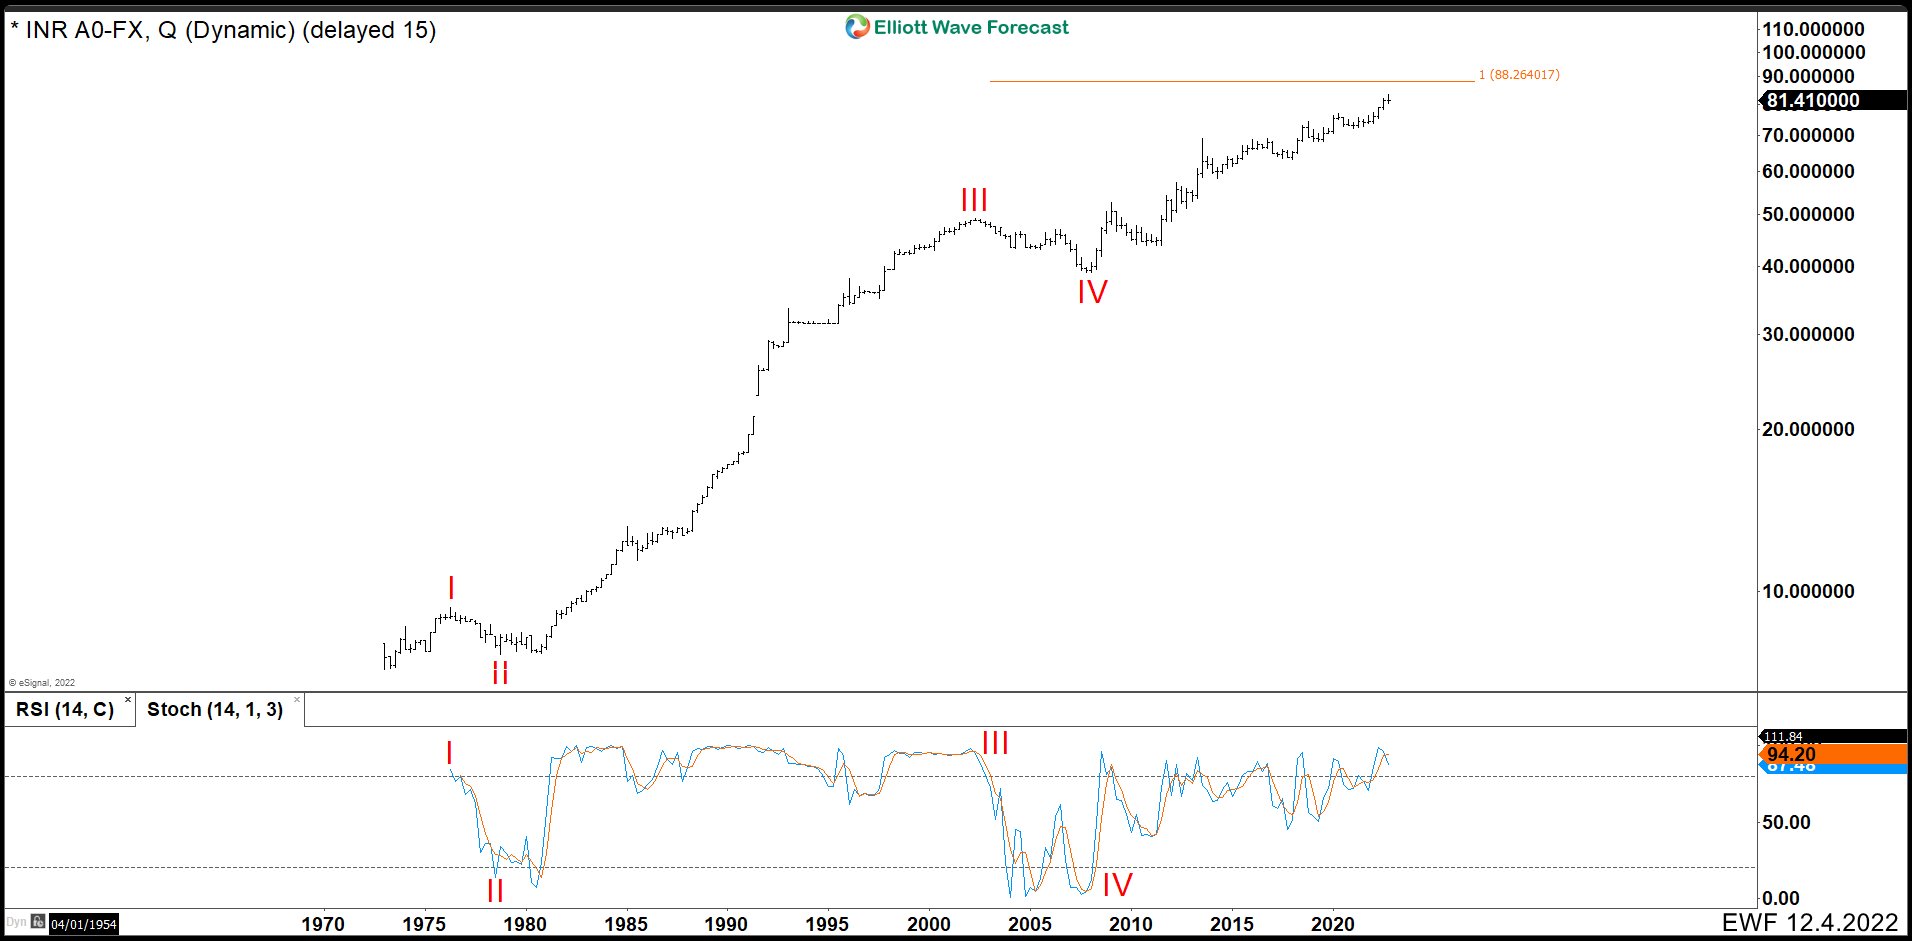
In the quarterly log chart, we could see USDINR is building an impulse since 1970. Wave I ended at 9.35 and pullback as wave II finished at 7.66. Then the pair had a big rally reached 49.16 as wave III. We could see wave III in the Stoch how in long term kept above 80 until wave IV appeared. Wave IV started in 2002 after Tech’s recession and continued until when Housing’s recession began. Since 2008, pair extended the rally from 39.01. It is developing a wave V of (I) that it looks like is not going to end soon. However, we could see an interesting pullback around 88.26 where it is the equal legs taken from wave III and IV.
Monthly USDINR Chart December 2022
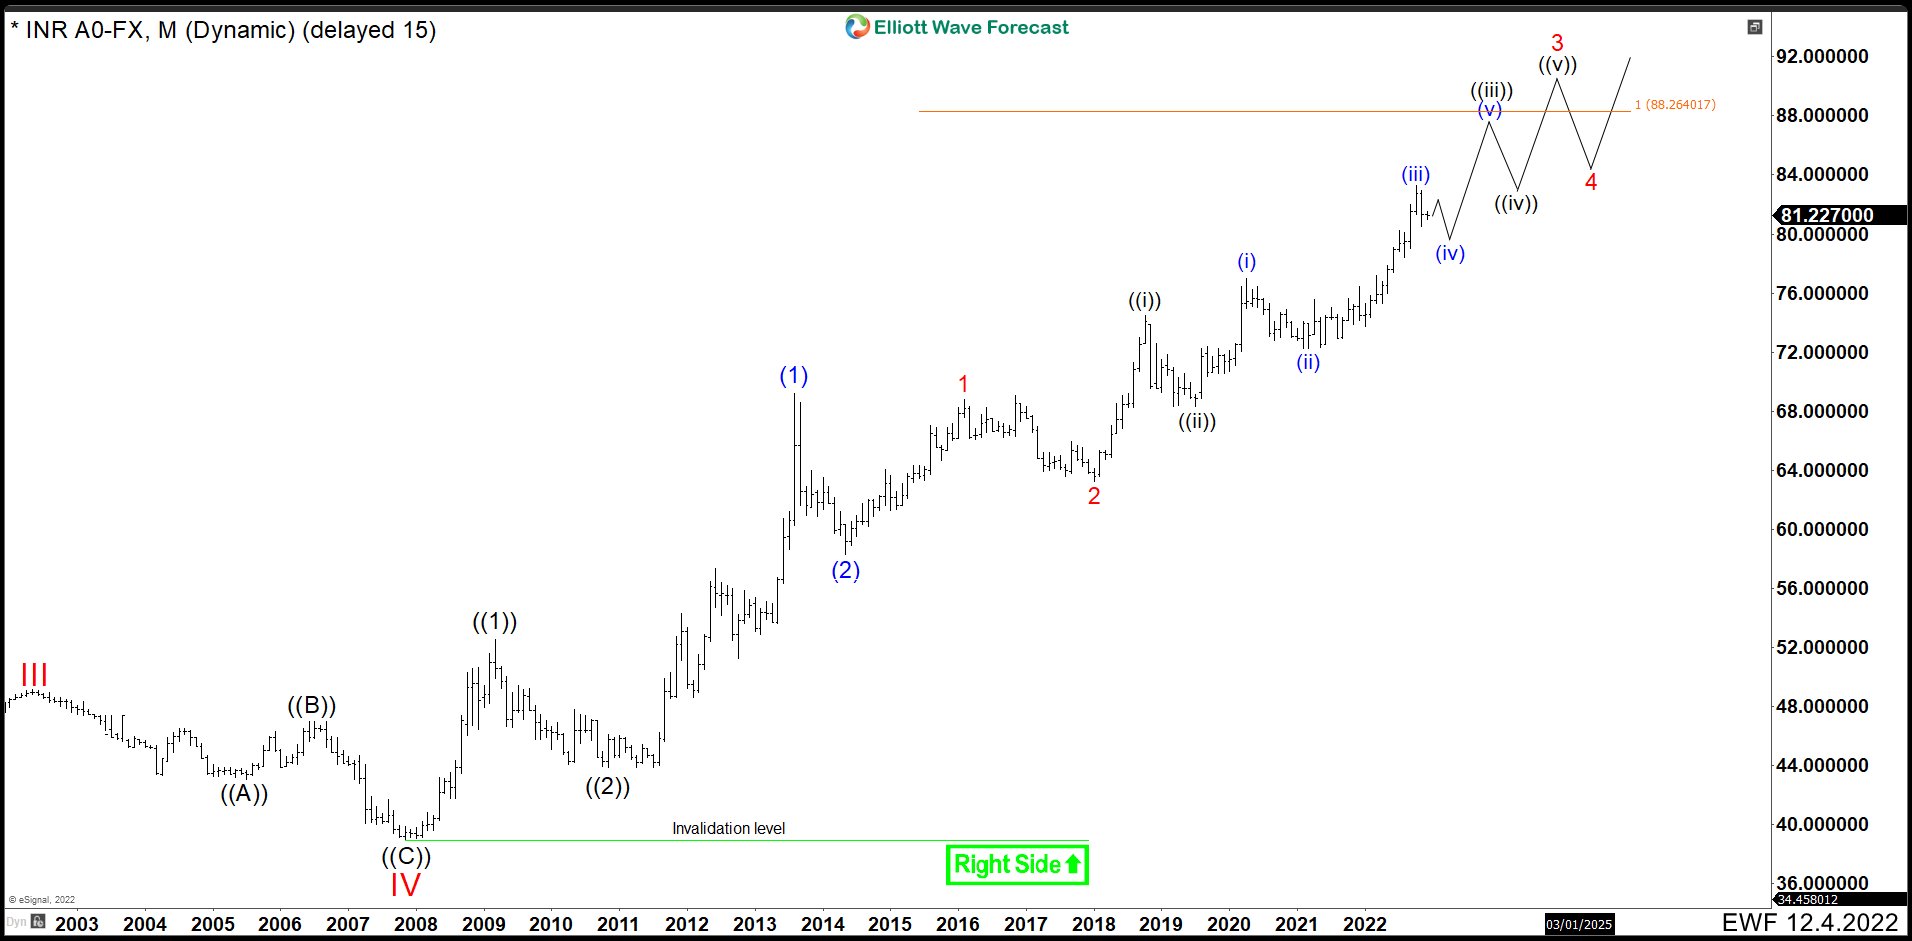
In the monthly chart, we saw that wave ((1)) of V ended at 52.51. Retracement as wave ((2)) of V at 43.88. Since then, the pair has held up in groups of waves 1 and 2 nesting in the market. This should continue with the uptrend in groups of waves 3 and 4.
Monthly USDINR Chart July 2023
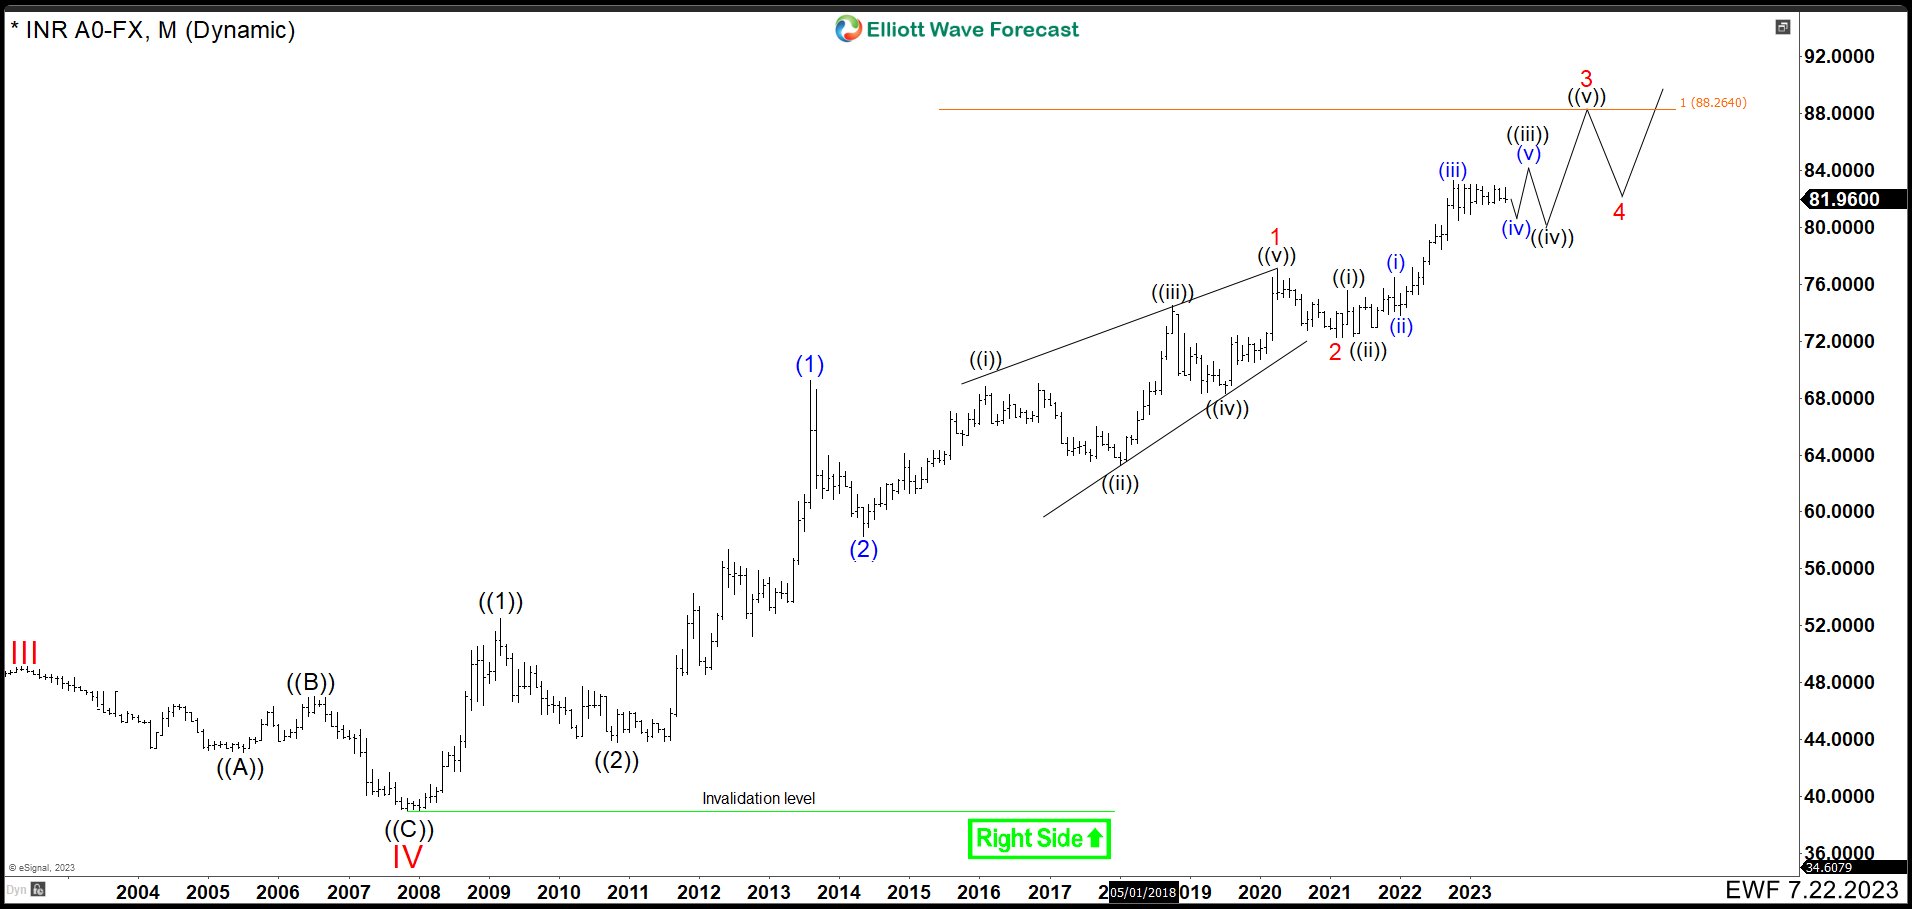
After 7 months ago, the rupees has been consolidating. This means the currency is building some wave 4, in this case wave (iv). Therefore, any breakout above 83.28 should be false because that break should be a wave (v) of ((iii)) and we should wait for a pullback in wave ((iv)) immediately. Thus, the market would continue with the bullish movement in groups of 3 and 4 waves. Besides, we are making some adjustments to the count. The principal changing is the leading diagonal as wave 1. This only affects the strength of the wave V and we are calling that wave 3 should hit 88.26 before entering in wave 4.