Silver Miners ETF (SIL) has ended the correction to the cycle from March 2020 low on Sept 26, 2022 low at 21.26. It is retesting the low on Sept 26, 202. As far as it stays above there, the ETF can start turning higher. We will take a look at the Elliott Wave view of the ETF below:
SIL (Silver Miners ETF) Monthly Elliott Wave Chart
 Monthly Elliott Wave chart of SIL above shows that the ETF ended all-time correction wave ((II)) at 14.94 in 2016. It then rallied in a series of I-II-((1))-((2)) as a nesting structure. Up from wave ((II)), wave I ended at 54.34 and wave II ended at 15.72. It then rallies again in wave ((1)) which ended at 52.87. Pullback in wave ((2)) ended at 21.26. As far as SIL stays above 15.72, expect the ETF to extend higher again.
Silver Miners ETF Daily Elliott Wave Chart
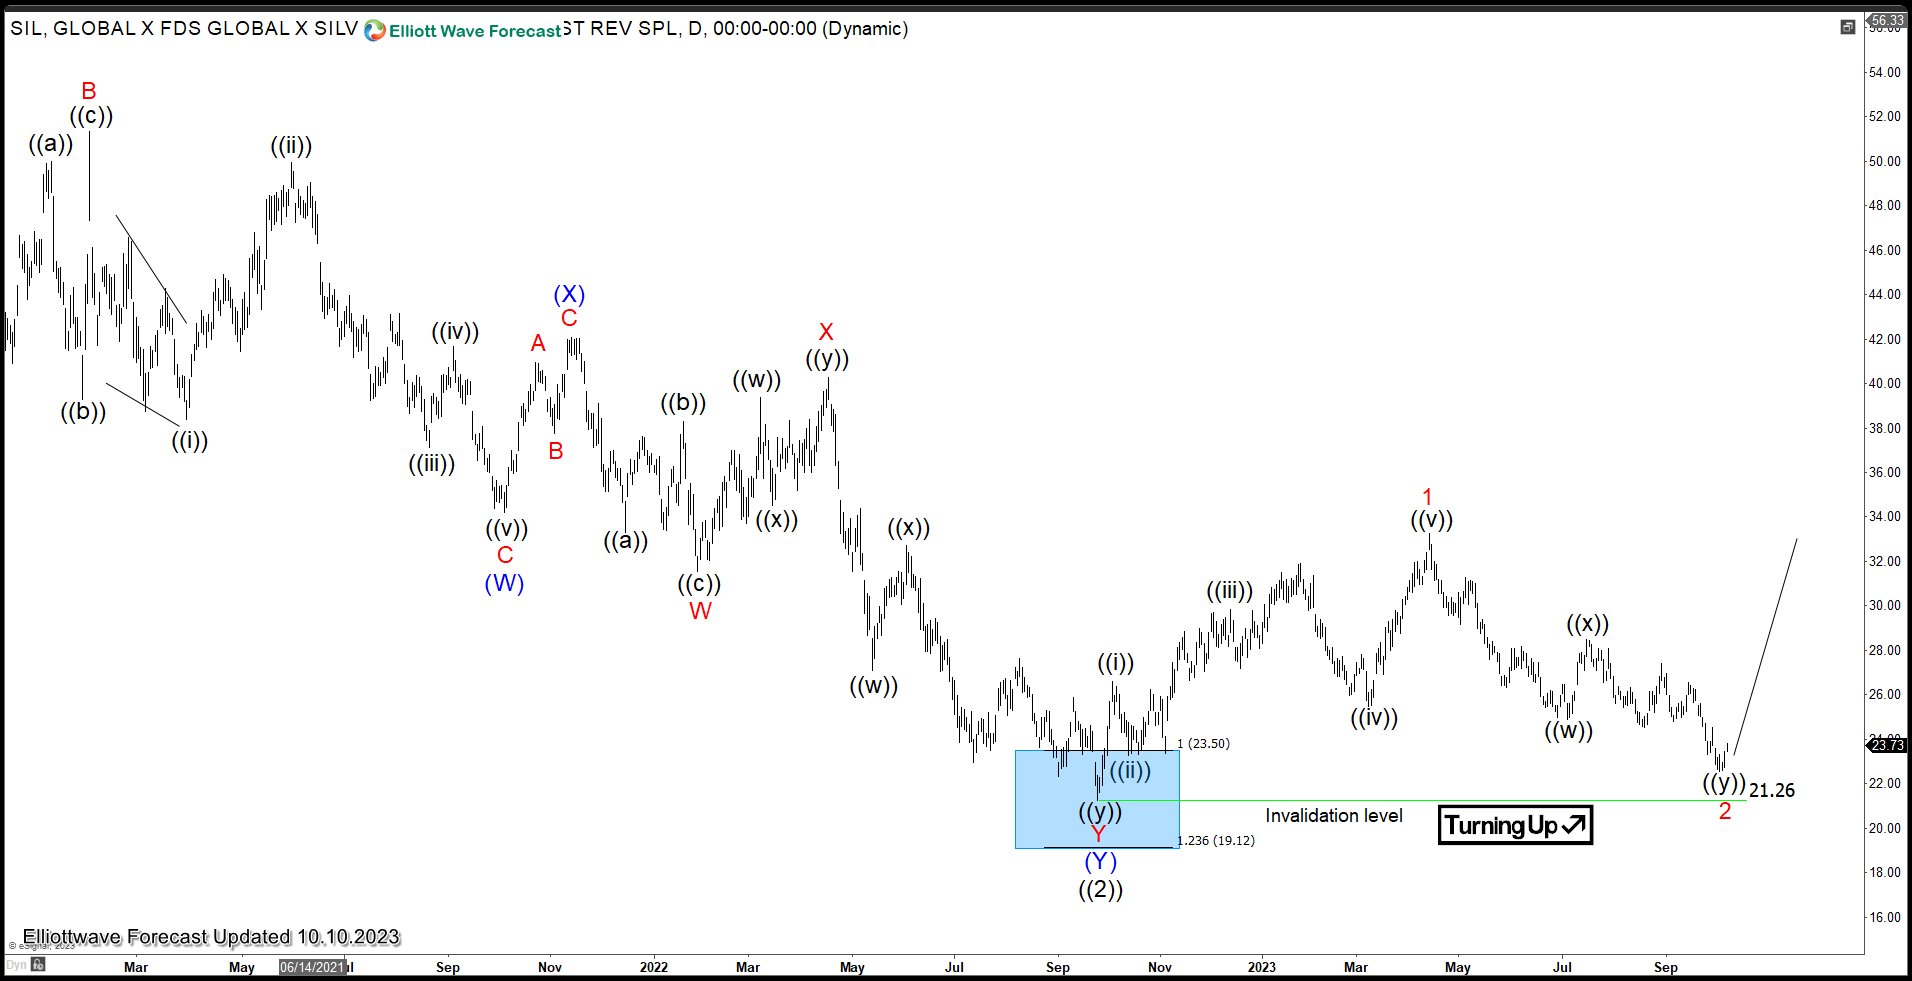
Daily Elliott Wave chart above shows that SIL may have ended correction to the cycle from 9.26.2022 low in wave 2 at 21.26. The ETF has started to turn higher but still needs to break above wave 1 at 33.24 to confirm this view. While it stays above 21.26, expect the ETF to extend higher.