One of the best ways to play the silver rally, if one believes in the bullish thesis, is through the Silver Miner ETF (SIL). The share price of these publicly traded mining companies usually climb faster than the precious metals that they produce during the bull market phase of the underlying metal. Since forming a top on August 6, 2020 high at 52.87, Silver Miners ETF (SIL) has continued to consolidate the gain. The internal subdivision of the pullback so far looks corrective, favoring further upside. We analyzed the Elliott Wave Chart of SIL below in Monthly and Daily time frames.
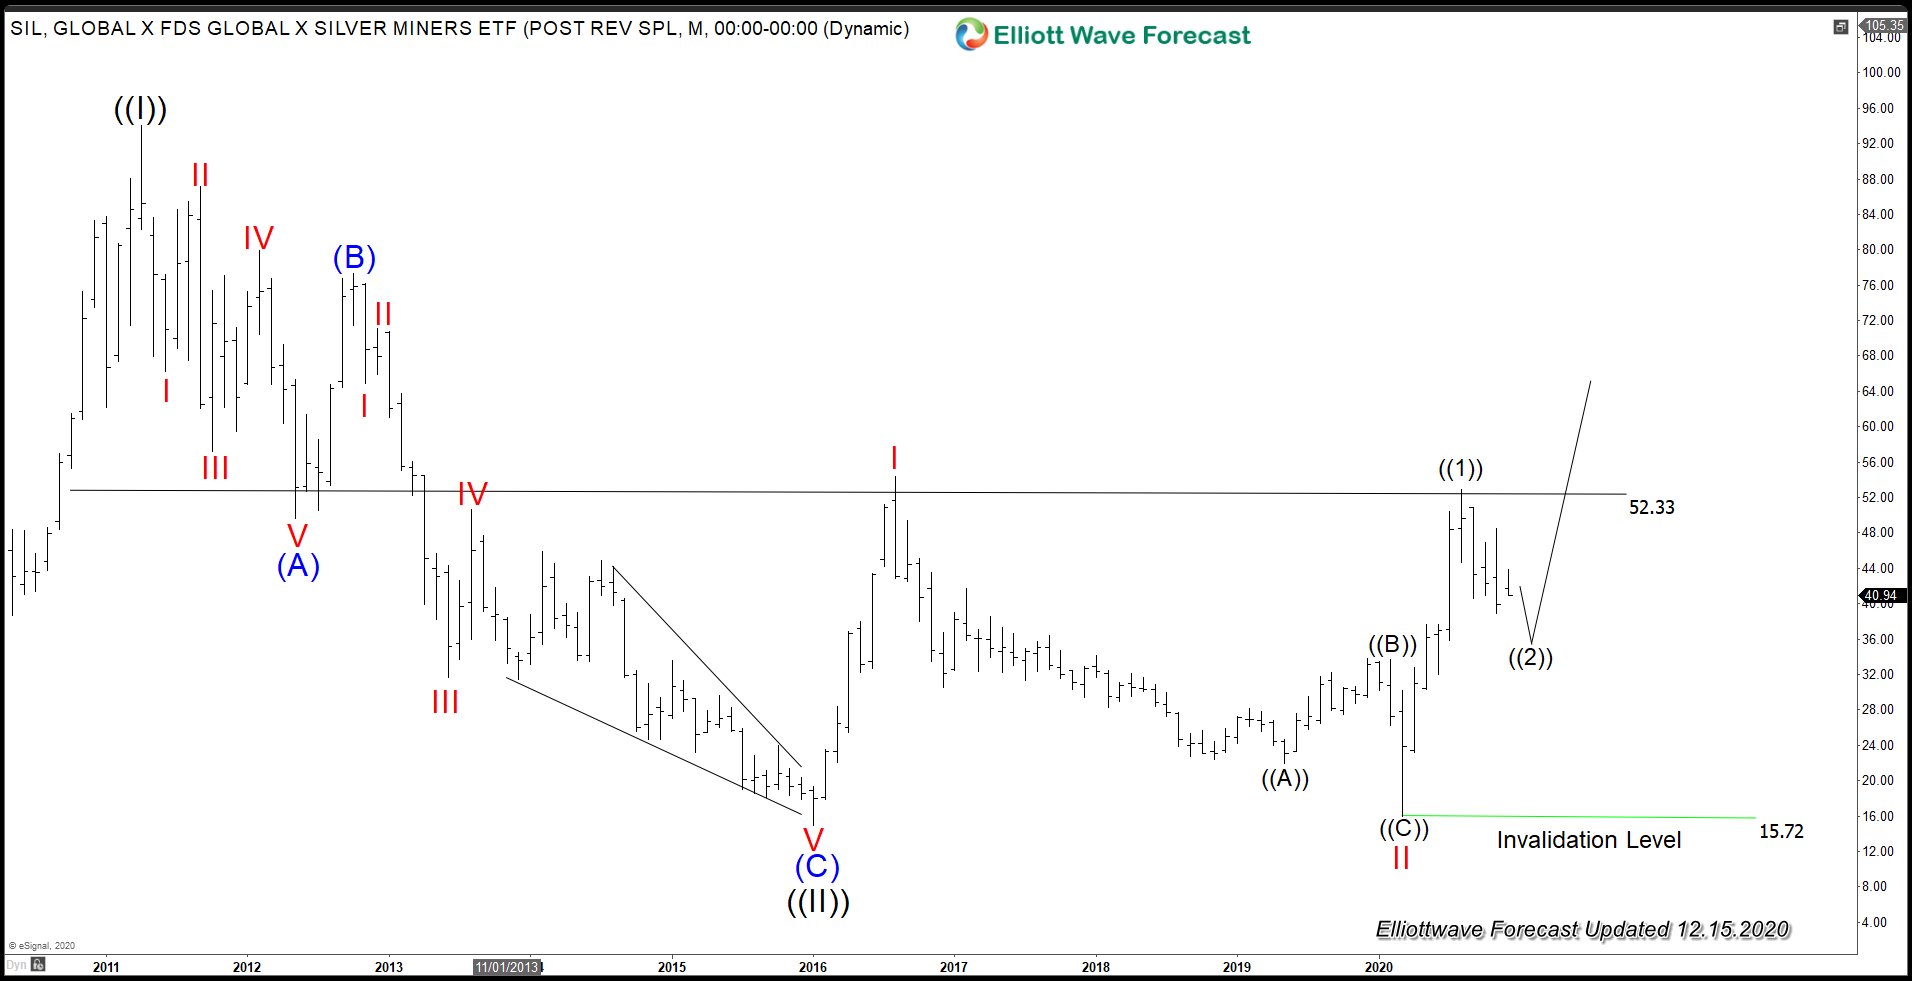
$SIL Monthly Elliott Wave Chart
Monthly chart of SIL above shows potential basing pattern since Jan 1, 2016 low. The ETF did a retest of that level earlier this year on March 3 during the Covid-19 selloff. We labelled that pullback as wave II which ended at 15.72. Since then the ETF has rallied again. The key resistance at $52 is still holding for now but a clear break above this line can turbocharge the rally in the sector next year. The ETF is currently looking to end the correction to cycle from March low and expected to find support in 3, 7, or 11 swing for more upside.
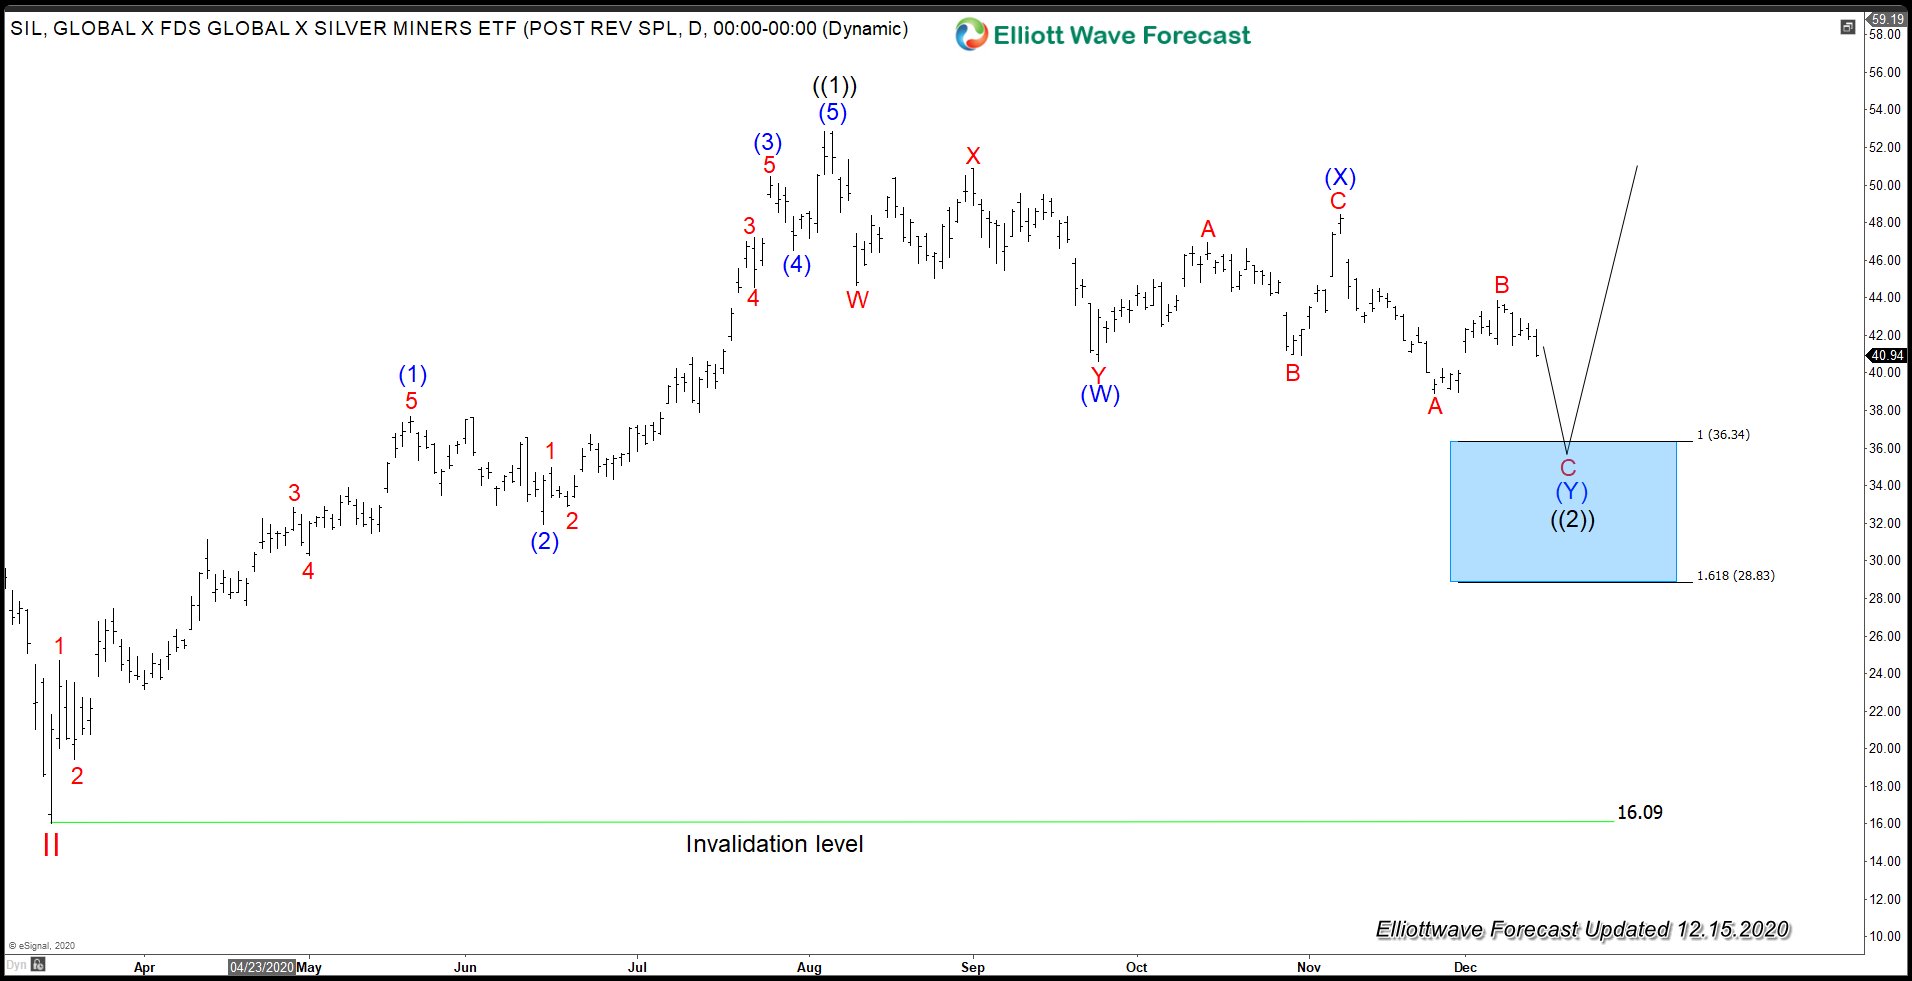
$SIL Daily Elliott Wave Chart
Daily Elliott Wave chart of SIL above shows the rally from wave II low on March 1 ended wave ((1)) at $52.87 as an impulsive Elliott Wave structure. Wave ((2)) pullback is in progress to correct cycle from March 1 low before the rally resumes. Structure of wave ((2)) looks corrective and unfolding with a possible double three corrective Elliott Wave pattern. Down from wave ((1)) high, wave (W) ended at 40.62 and wave (X) ended at 48.45. Wave (Y) is expected to find support in 3 or 7 swing. The next 100% - 161.8% extension area comes at 26.8 - 36.3 where buyers can appear for new high or 3 waves bounce at least. Expect the ETF to continue higher again in a strong wave ((3)) rally once current correction ends as far as pivot at 16.09 low stays intact.

