This is a very simple price action-based strategy which has a positive win rate across forex pairs. Many systems follow a similar principle, that an Inside Bar signifies congestion and that price will probably break out upwards or downwards after the IB within a very short time period.
I have been looking at this on D1 charts. The idea is to wait for an IB, then set a buy order a little above the daily high of the IB and a sell order a little below the low. Set a stop-loss on the long at the sell order price and a stop-loss on the short at the buy order price. Order sizes are adjusted according to personal risk tolerance. Exit the open position at the next Close if it is in profit. If its not yet in profit, just wait for the next Close etc. etc.
If the chart shows another IB following after the first, re-set your orders using the second IB’s high and low, but don’t forget to adjust the stop-losses and position sizes as well.
I will write an EA for this in some free time Do you have some backtesting stats for this one?
Closing at nearest profitable candle close means, that profits will be usually much smaller than losses - is this compensated by very high win rate? Cheers!
I have some rough and ready statistics from backtesting.
Across the 28 leading pair charts over the last 3 months, the win rate would be 65%, from 281 trades.
Taking signals for the majors only, the win rate is 66%, so not worth narrowing the field on this basis. But focusing on the most volatile 9 pairs (historically) pushes the win rate to 81%.
5 of the best win rates occur in the 9 most volatile pairs.
Best individual pairs over the last 3 months are CAD/JPY (100%, 7/7 wins) and CAD/CHF (100%, 8/8/wins).
Losses are also off-set by regular exceptionally large wins.
Hi Tommor
I had a quick look at AUDJPY D1 from 1Feb. There were 12 trades:
7 Feb W
18 Feb L
6 Apr W
8 Apr W
14 Apr L
29 Apr L
13 May W
25 May W
20 June W
24 June L
29 June W
4 July L
So, 7W and 5L or 58% W/L
5 out of 7 winners came from long trades.
Yes, I was a bit surprised that AUD/JPY, as the historically most volatile pair by a long way (apart from its twin, NZD/JPY) was not the best performing pair at this strategy. Yet I marked it at 72% over the last 3mths and NZD/JPY at only 50%.
I’m thinking that this strategy will be a basket strategy, so that the trader takes all the IB trades possible from all pairs in every day. In that way, statistics will provide the profits, rather than TA. A shotgun approach rather than sniping.
I didn’t log whether longs or shorts give a higher win rate - that’s because I suspect if anything modifies the win rate it will be with-trend/counter-trend, rather than long/short. That raises the question of how to confirm a trend. There are lots of modifications open in a strategy lie this - an obvious one would be varying the size or location of certain entry orders depending on whether they would lead to a with-trend or counter-trend position.
As we speak I have one pair of IB orders set, on GHBP/USD, based on the range of 20/07.
This is a slightly unusual situation as technically if I had set these orders at the close of 20/07 both would by now have been triggered and both would have been stopped out. But as there has not yet been a close within the range of 20/07, there’s an argument that the break-out from the IB’s congestion has not yet taken place, so its possibly worth a shot as a practice run.
This is a variation on the sideways triangle, no? Larger Candlesticks gradually tapering down smaller and smaller to a point, over time. Resulting breakout usually in the direction of the main trend?
The orders I am using are not linked with each other but the order has a stop-loss at the same price as the entry order in the opposite direction, so as one closes the other opens, and its not possible to have two positions open simultaneously.
I don’t really want one order to cancel the other as if price triggers one order but then reverses and breaks out through the opposite end of the range I want the chance that he second position will balance some of the loss of the first. Of course, it will also be possible that the second order gets stopped out too…
Yes, an Inside Bar is like the truncated base of a triangle. If you see 2 or IB’s progressing consecutively, this makes the triangle image clearer to see. This is the essence of IB theory - that price will go on to make an energetic break-out, not just a simple move up or down.
Thanks for explaining this. So, if you’re not cancelling the second order - how long it will stay valid? By the description, I would assume, that if long is triggered to open, then sell pending trade is alive until long trade is closed with profit.
Why don’t you not set a stop-loss, keep the trade that you set that goes in the other direction (at the level that your stop loss was going to be) then, if the trade doesn’t go the way you want, set up another trade at the next point where you think it will breakout, hence giving yourself another go at profit without any real losses or being stopped-out? Then if you make a profit in one direction, you might even make a second profit if the trade subsequently reverses? Not sure if i’ve explained this very well…
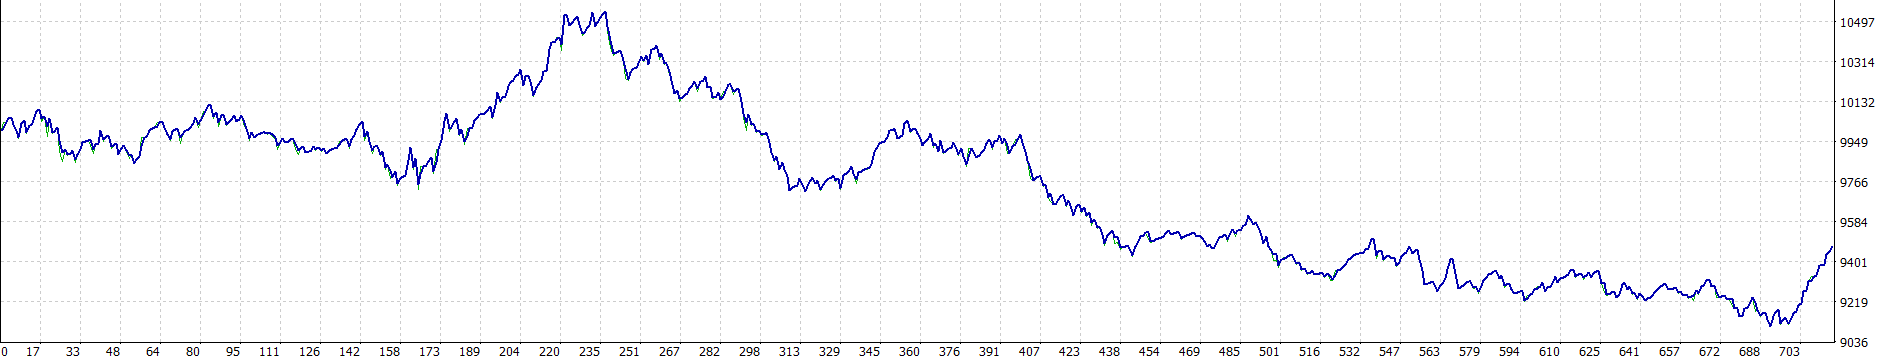
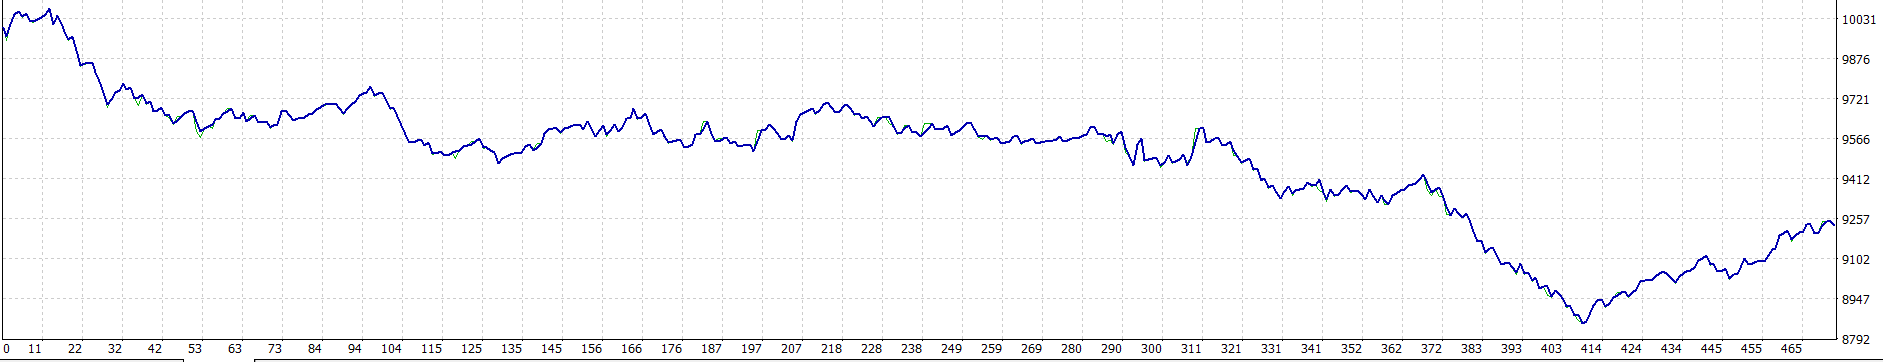
I’ve wrote an EA for this strategy and it does not look like very profitable in the long run.
It’s interesting how USDJPY results are significantly different than others
Well this is interesting and has some unexpected conclusions. Thanks for the backtesting. I’m not surprised the majors performed badly, they are generally low volatility. But I didn’t expect performance to be this bad.
Yes, USD/JPY stands out as not just a positive result but notably consistent. Yen pairs are the most volatile - 6 out of 7 are in the 9 most volatile pairs. But USD/JPY is the least volatile Yen pair and not very volatile anyway. I guess something else is going on which I fail to see yet.
This is a strategy I would only attempt on the most volatile pairs. What I want to see is dramatic urgent movement away from a short congestion period - in and out within 2 days would be the ideal.
Could you please try a variation:
If 20 EMA is above 50 EMA only place long orders
If 20 EMA is below 50 EMA Only place short orders
Also, can try incorporate the price into above. That is, only place orders if the price is above 20 EMA for long and below 20 EMA for short.
 Do you have some backtesting stats for this one?