Skyway's Trading Journal

Hi ! I’m Skyway.

I’m going to record all my trades since this is one of the best ways to improve myself. Recording my trades helps me see what works and what doesn’t.

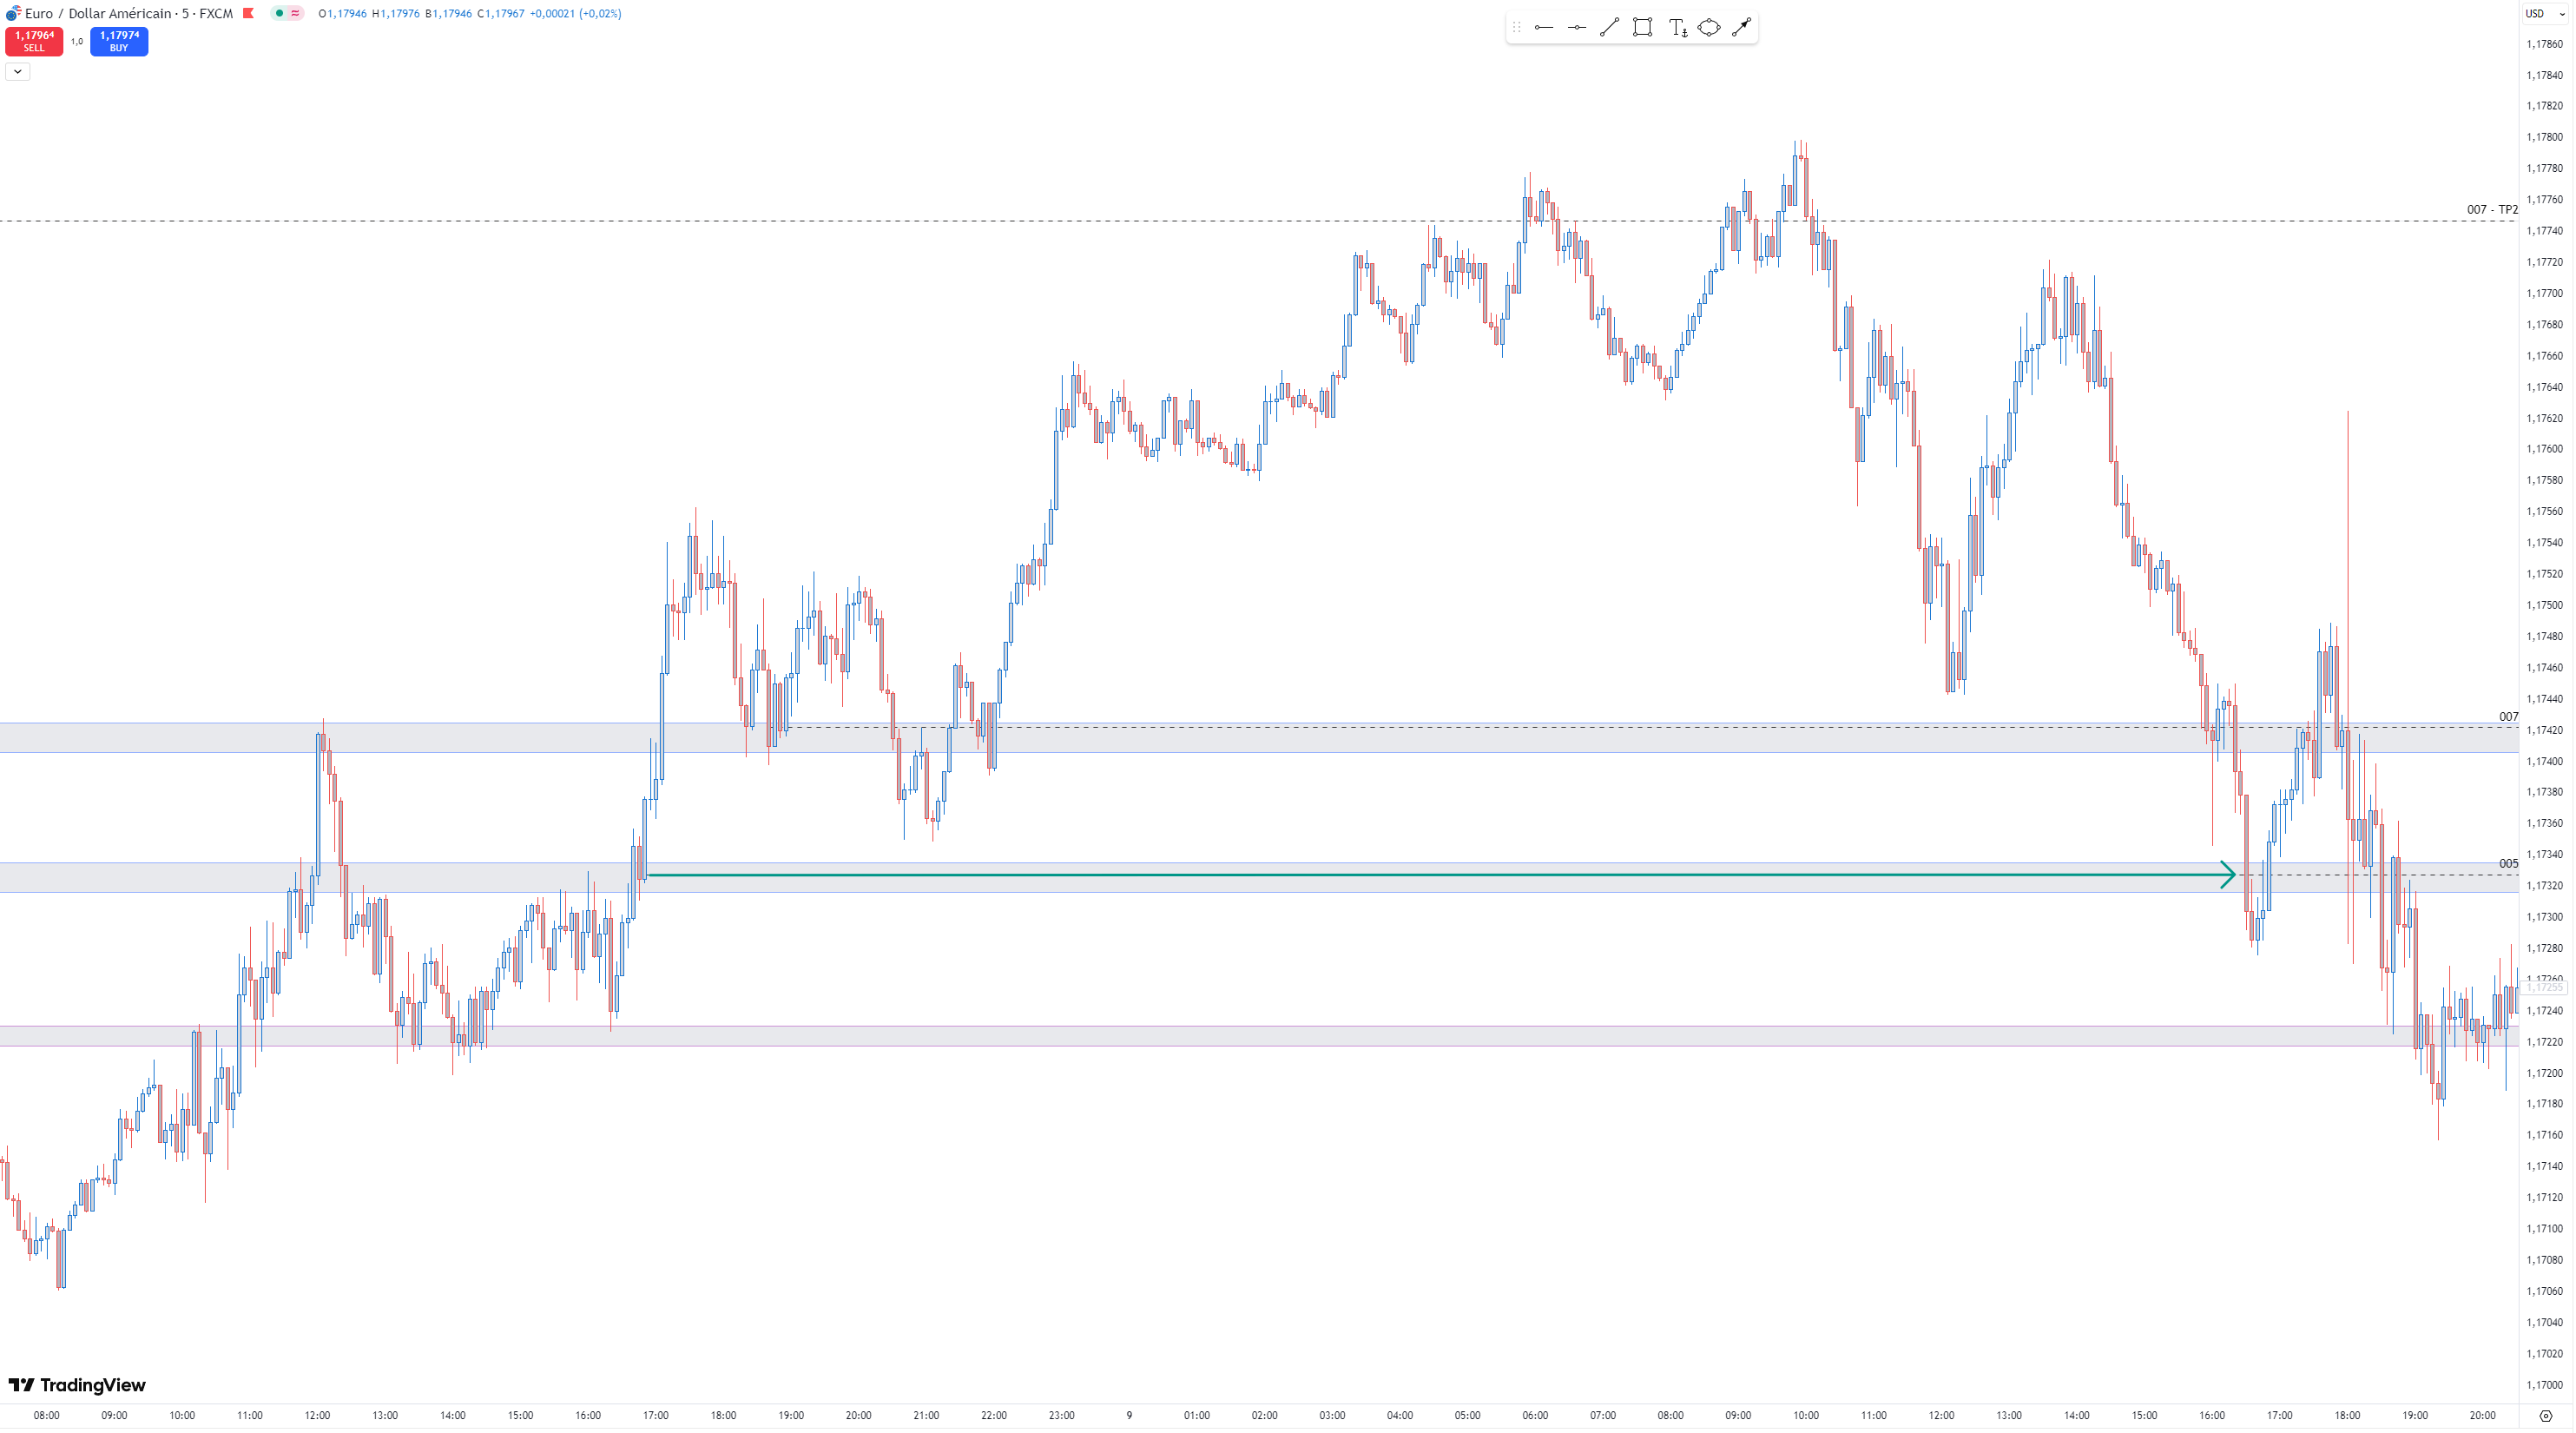
The way I trade is very simple. I focus on supports / resistances and what I call “candlesticks awarness”. It’s not something I’ve invented, but it’s something that rings a bell to me. And when I feel lost in my charts, I use Ichimoku to see the relevant supports / resistances zone I may miss or have a doubt.

Each of my posts will deal with only one trade, so it means that they will me modified / updated regularly.

If you have any suggestion to help me improve my trading feel free to talk to me or comment my trades.

2 Likes

I’m in to see what you’ve got! Wishing you nothing but success.

1 Like

This will be interesting! I don’t know if it’s what you do but I’ve heard of people looking at the forward-shifted “kumo” to identify potential future support and resistance. I don’t know how it works, though.

(I use recent or multiple swings low by prices to identify significant historical support and recent or multiple swings high by prices to identify significant historical resistance. Not always helpfully, of course, because “historical” and “future” aren’t always the same.)

Looking forward to seeing. Good luck! :slight_smile:

1 Like

Trade 001 - Long EUR/USD


Monthly: Long until 1.22200


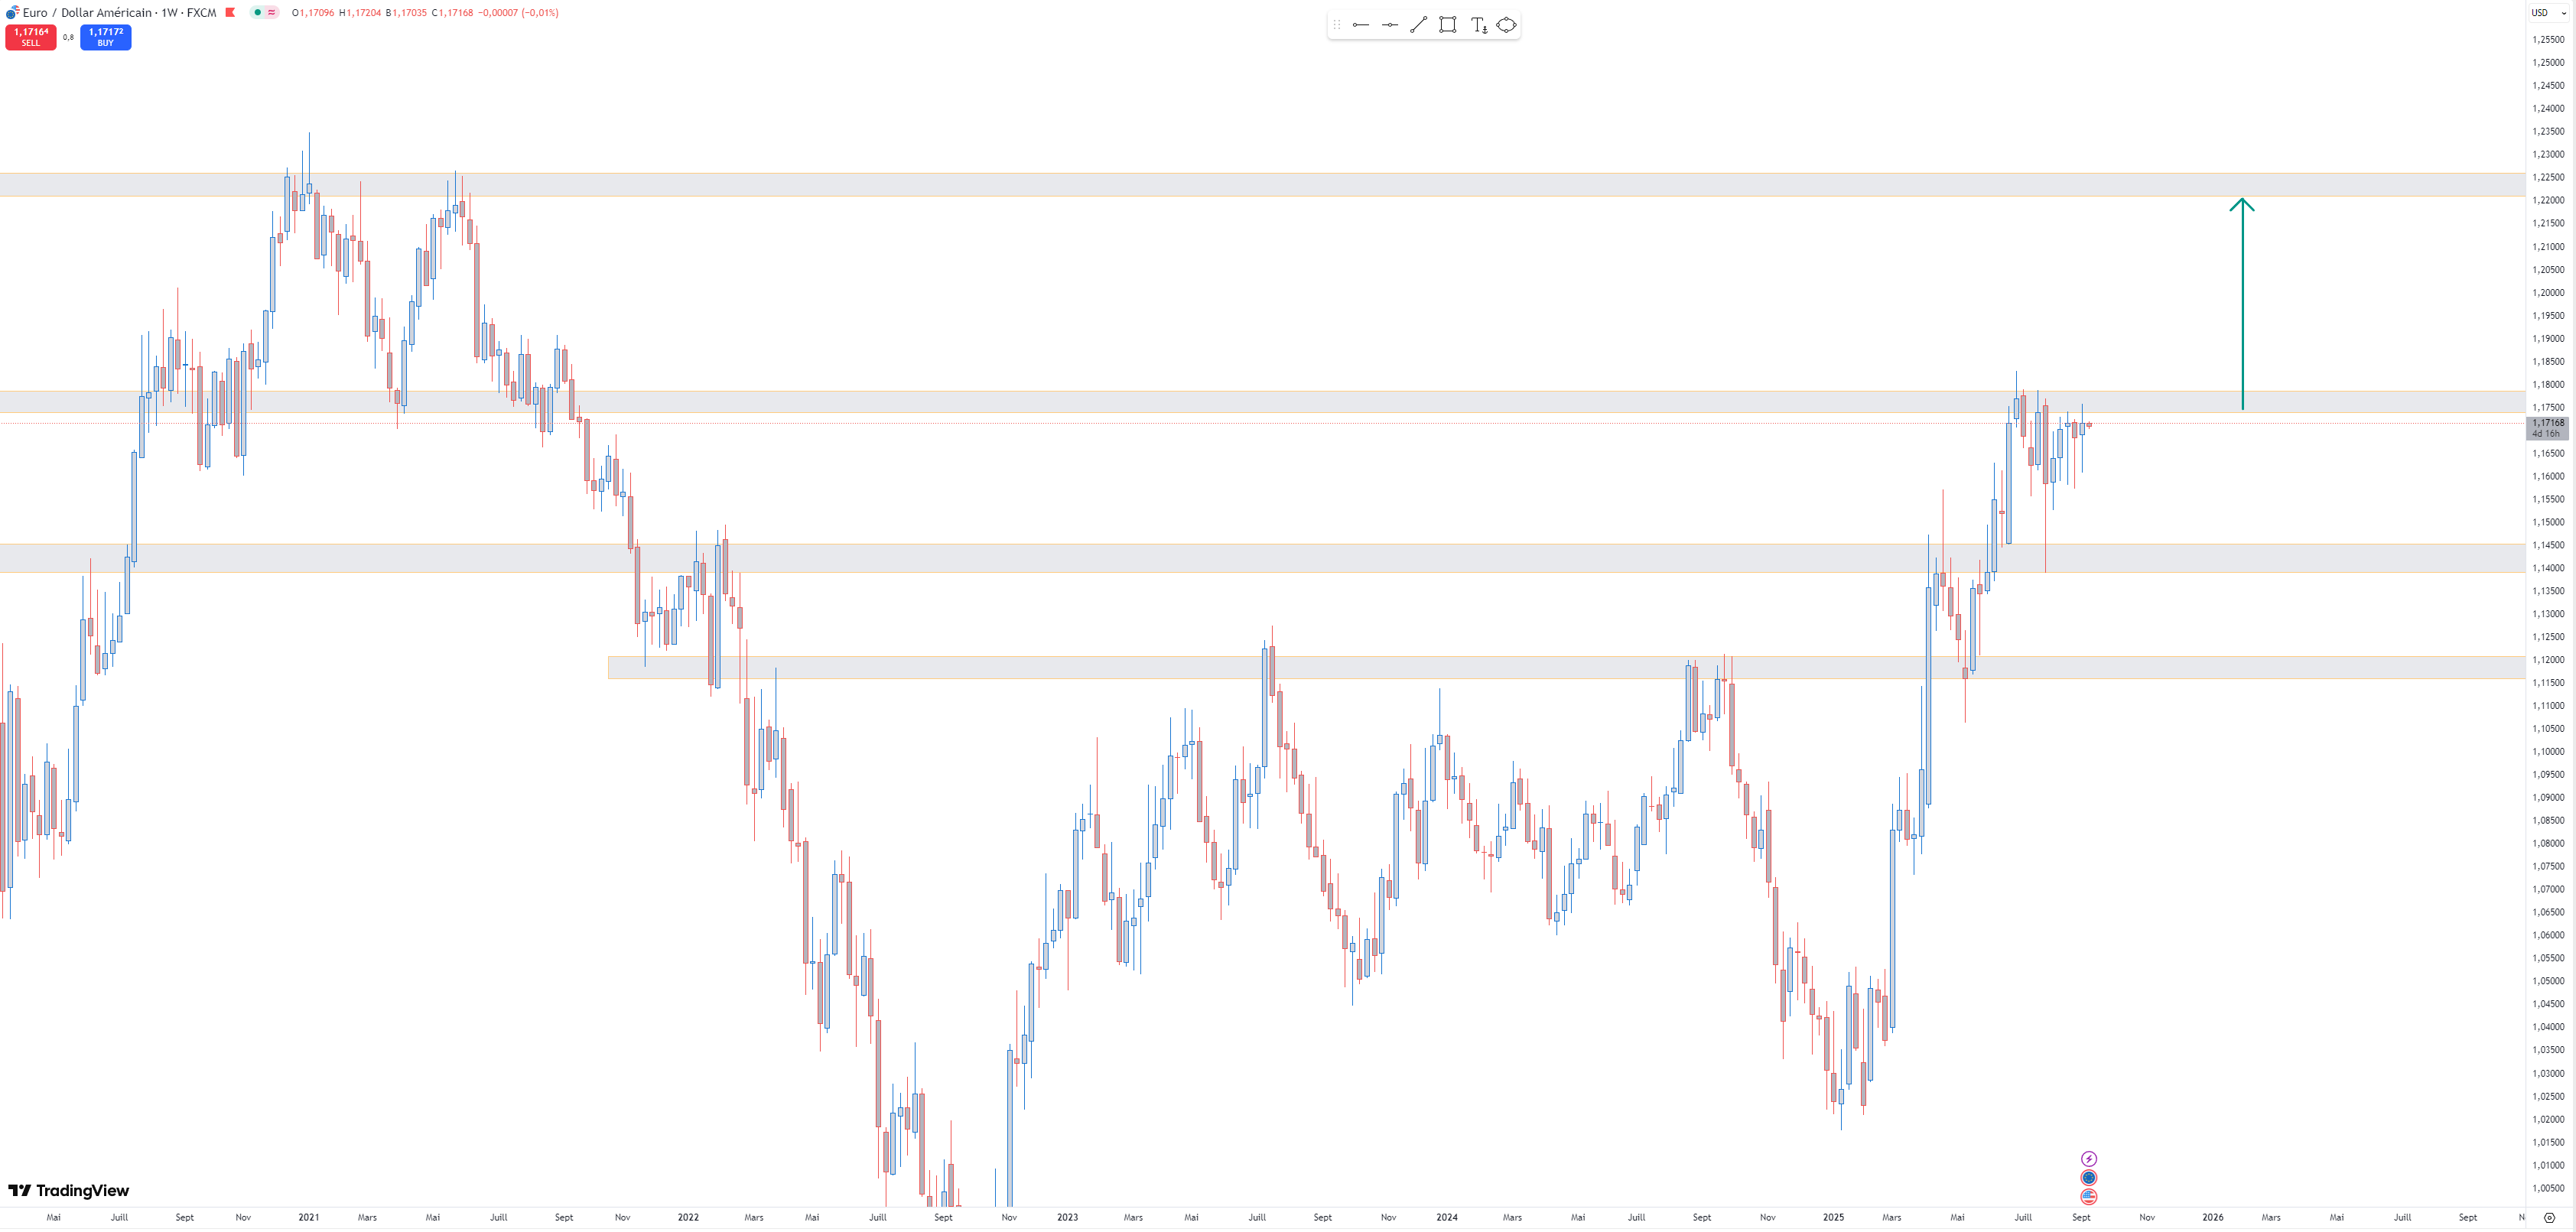
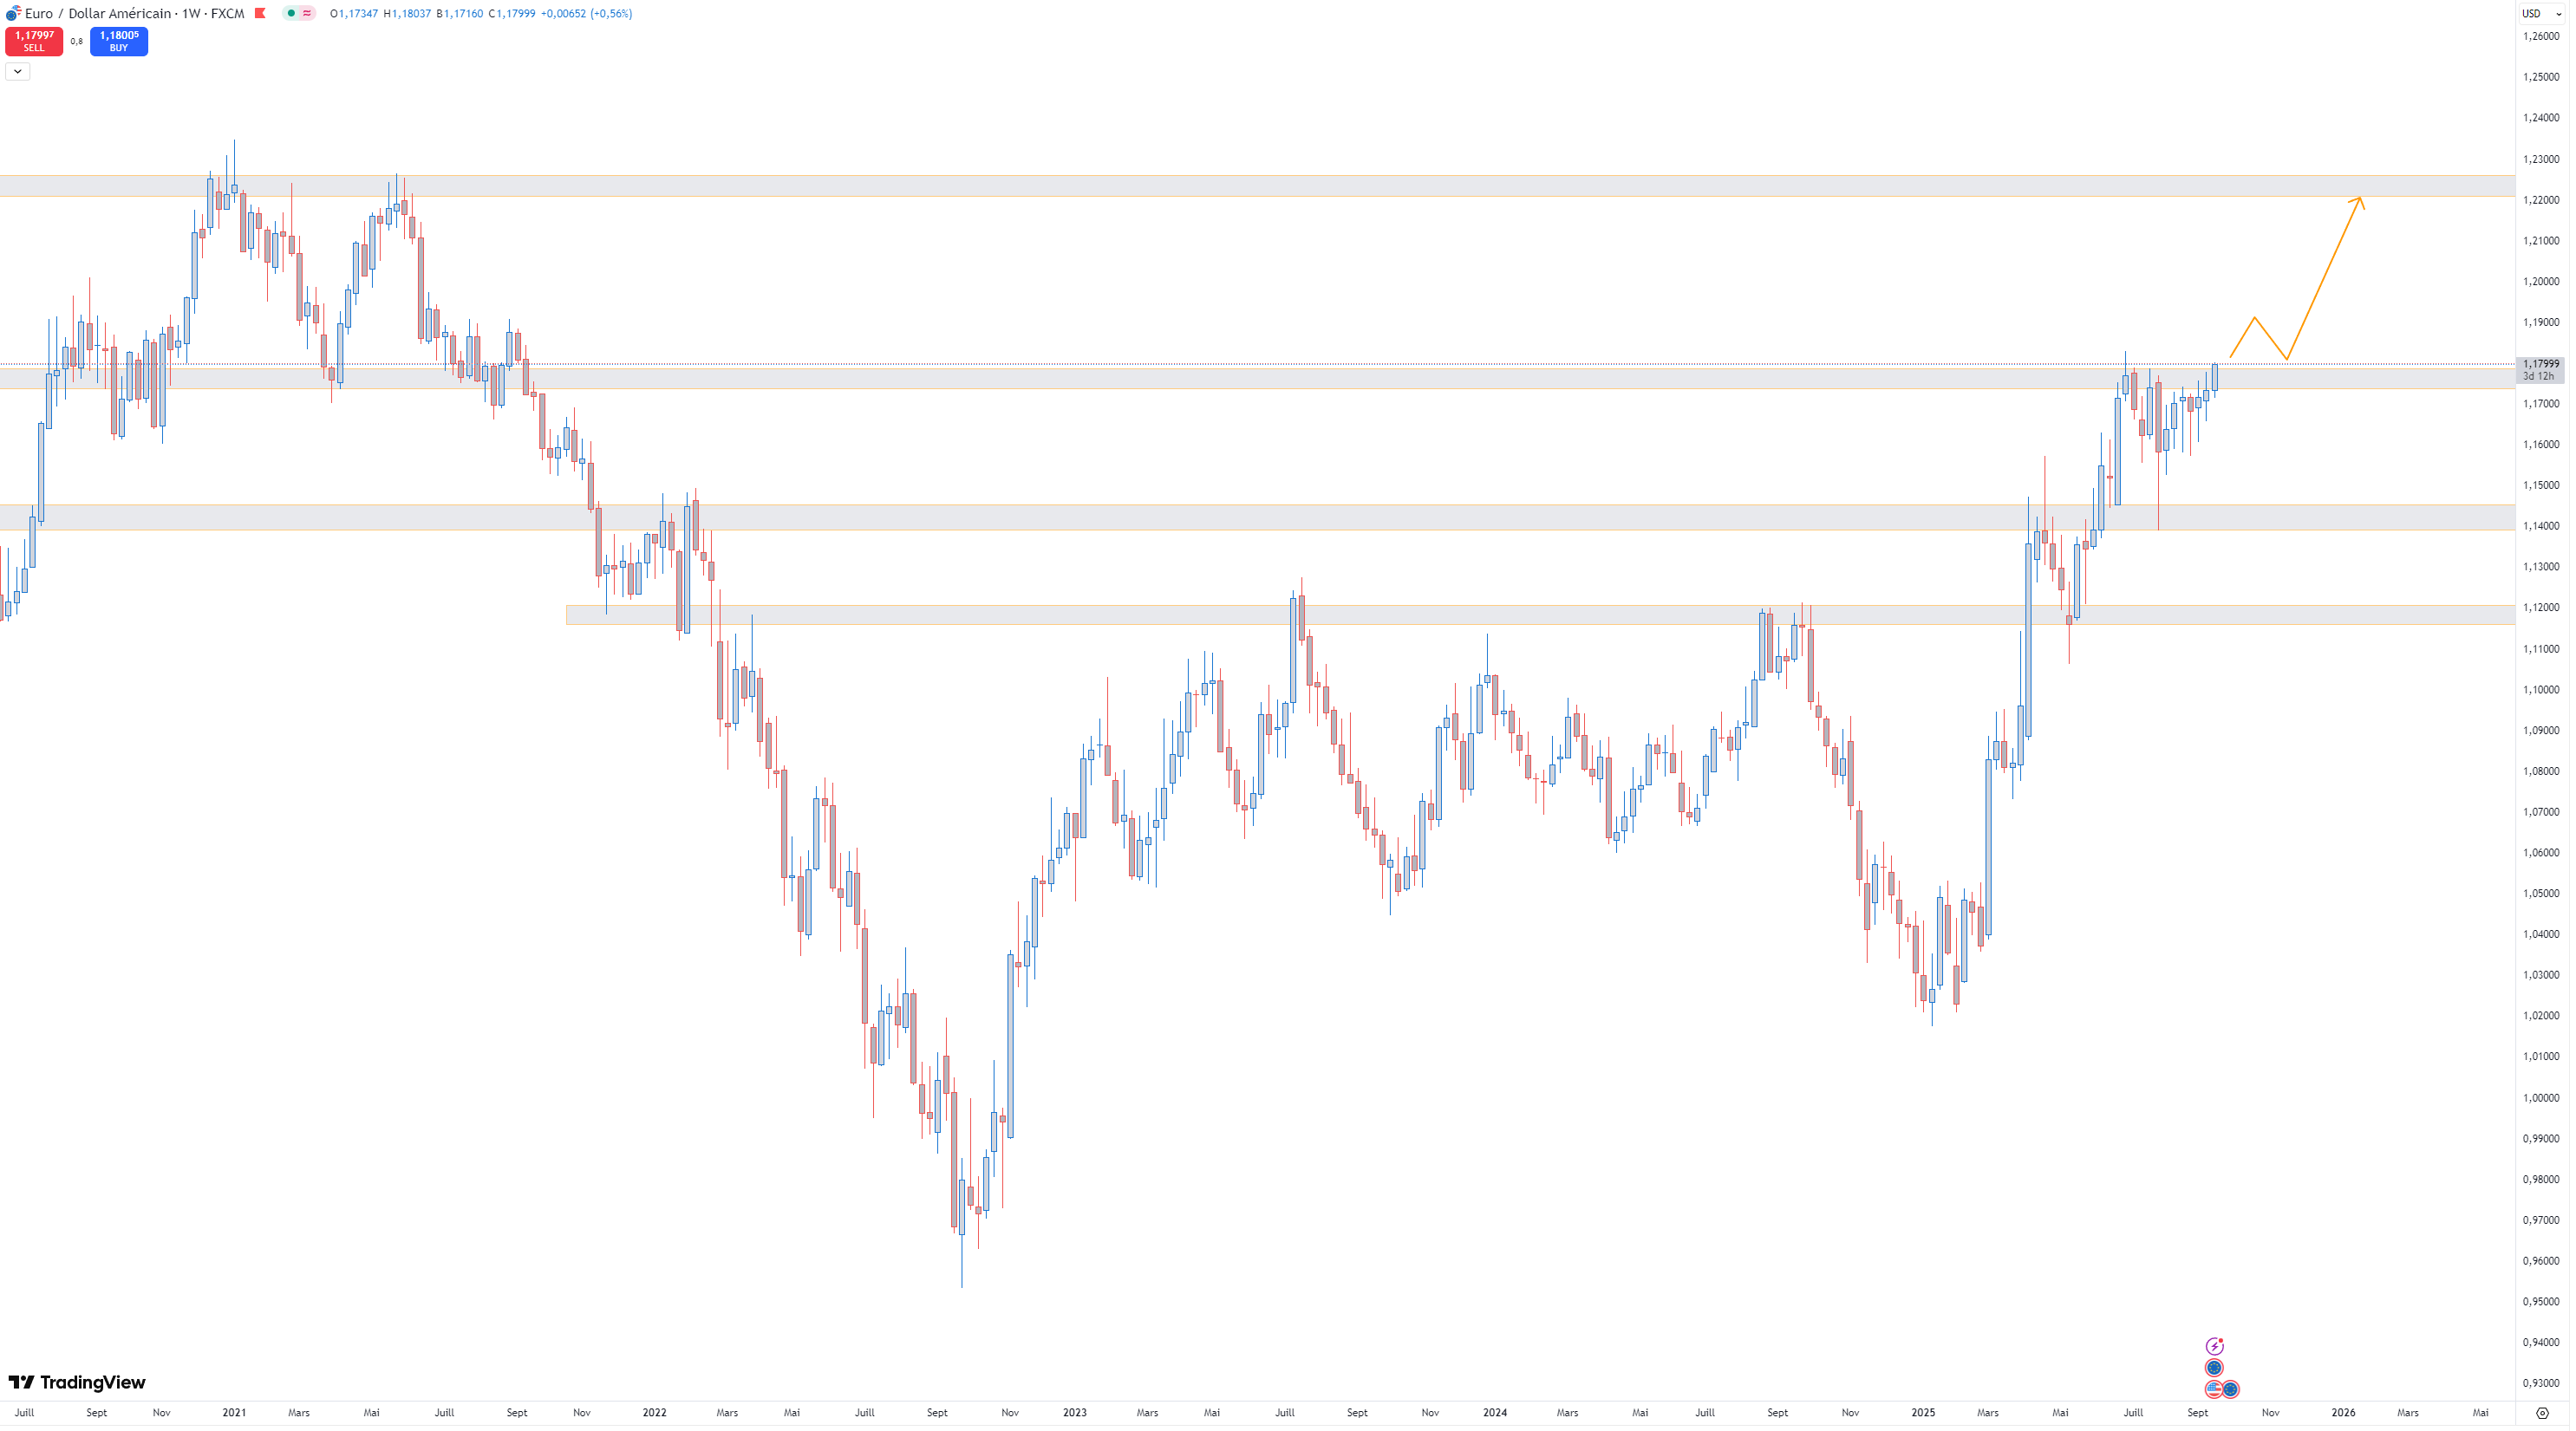
Weekly: Under a resistance, but the “situational awarness” shows 3 previous candlesticks with a long tail meaning the buyers are there for the last 3 weeks.
It would have been safer to wait the resistance to break.


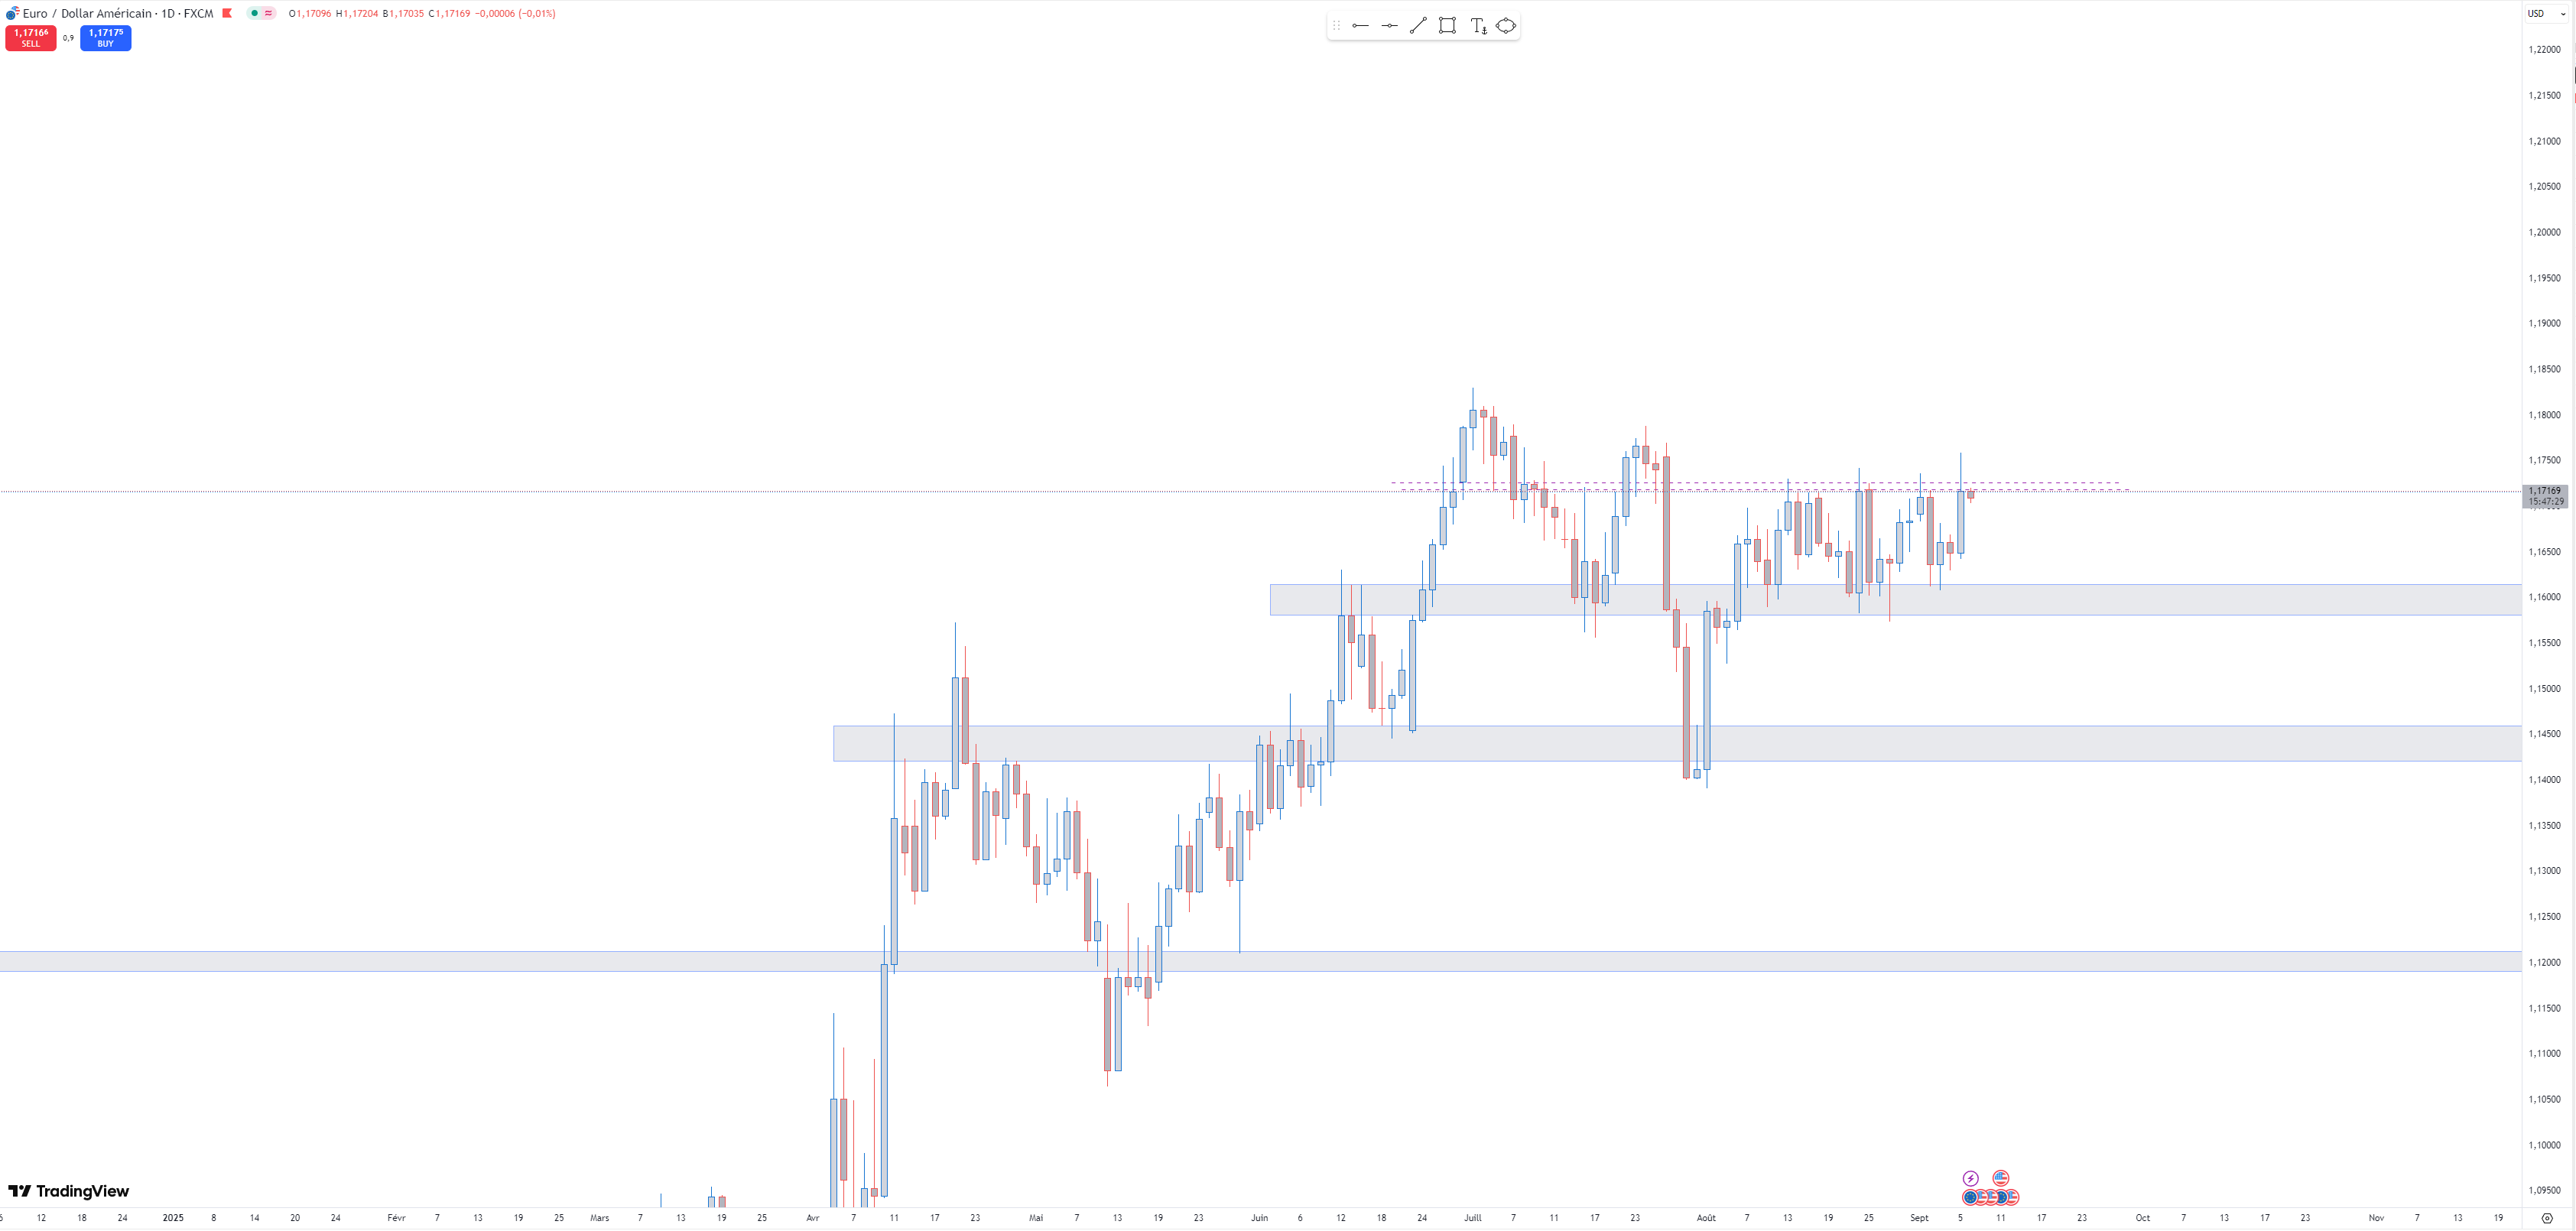
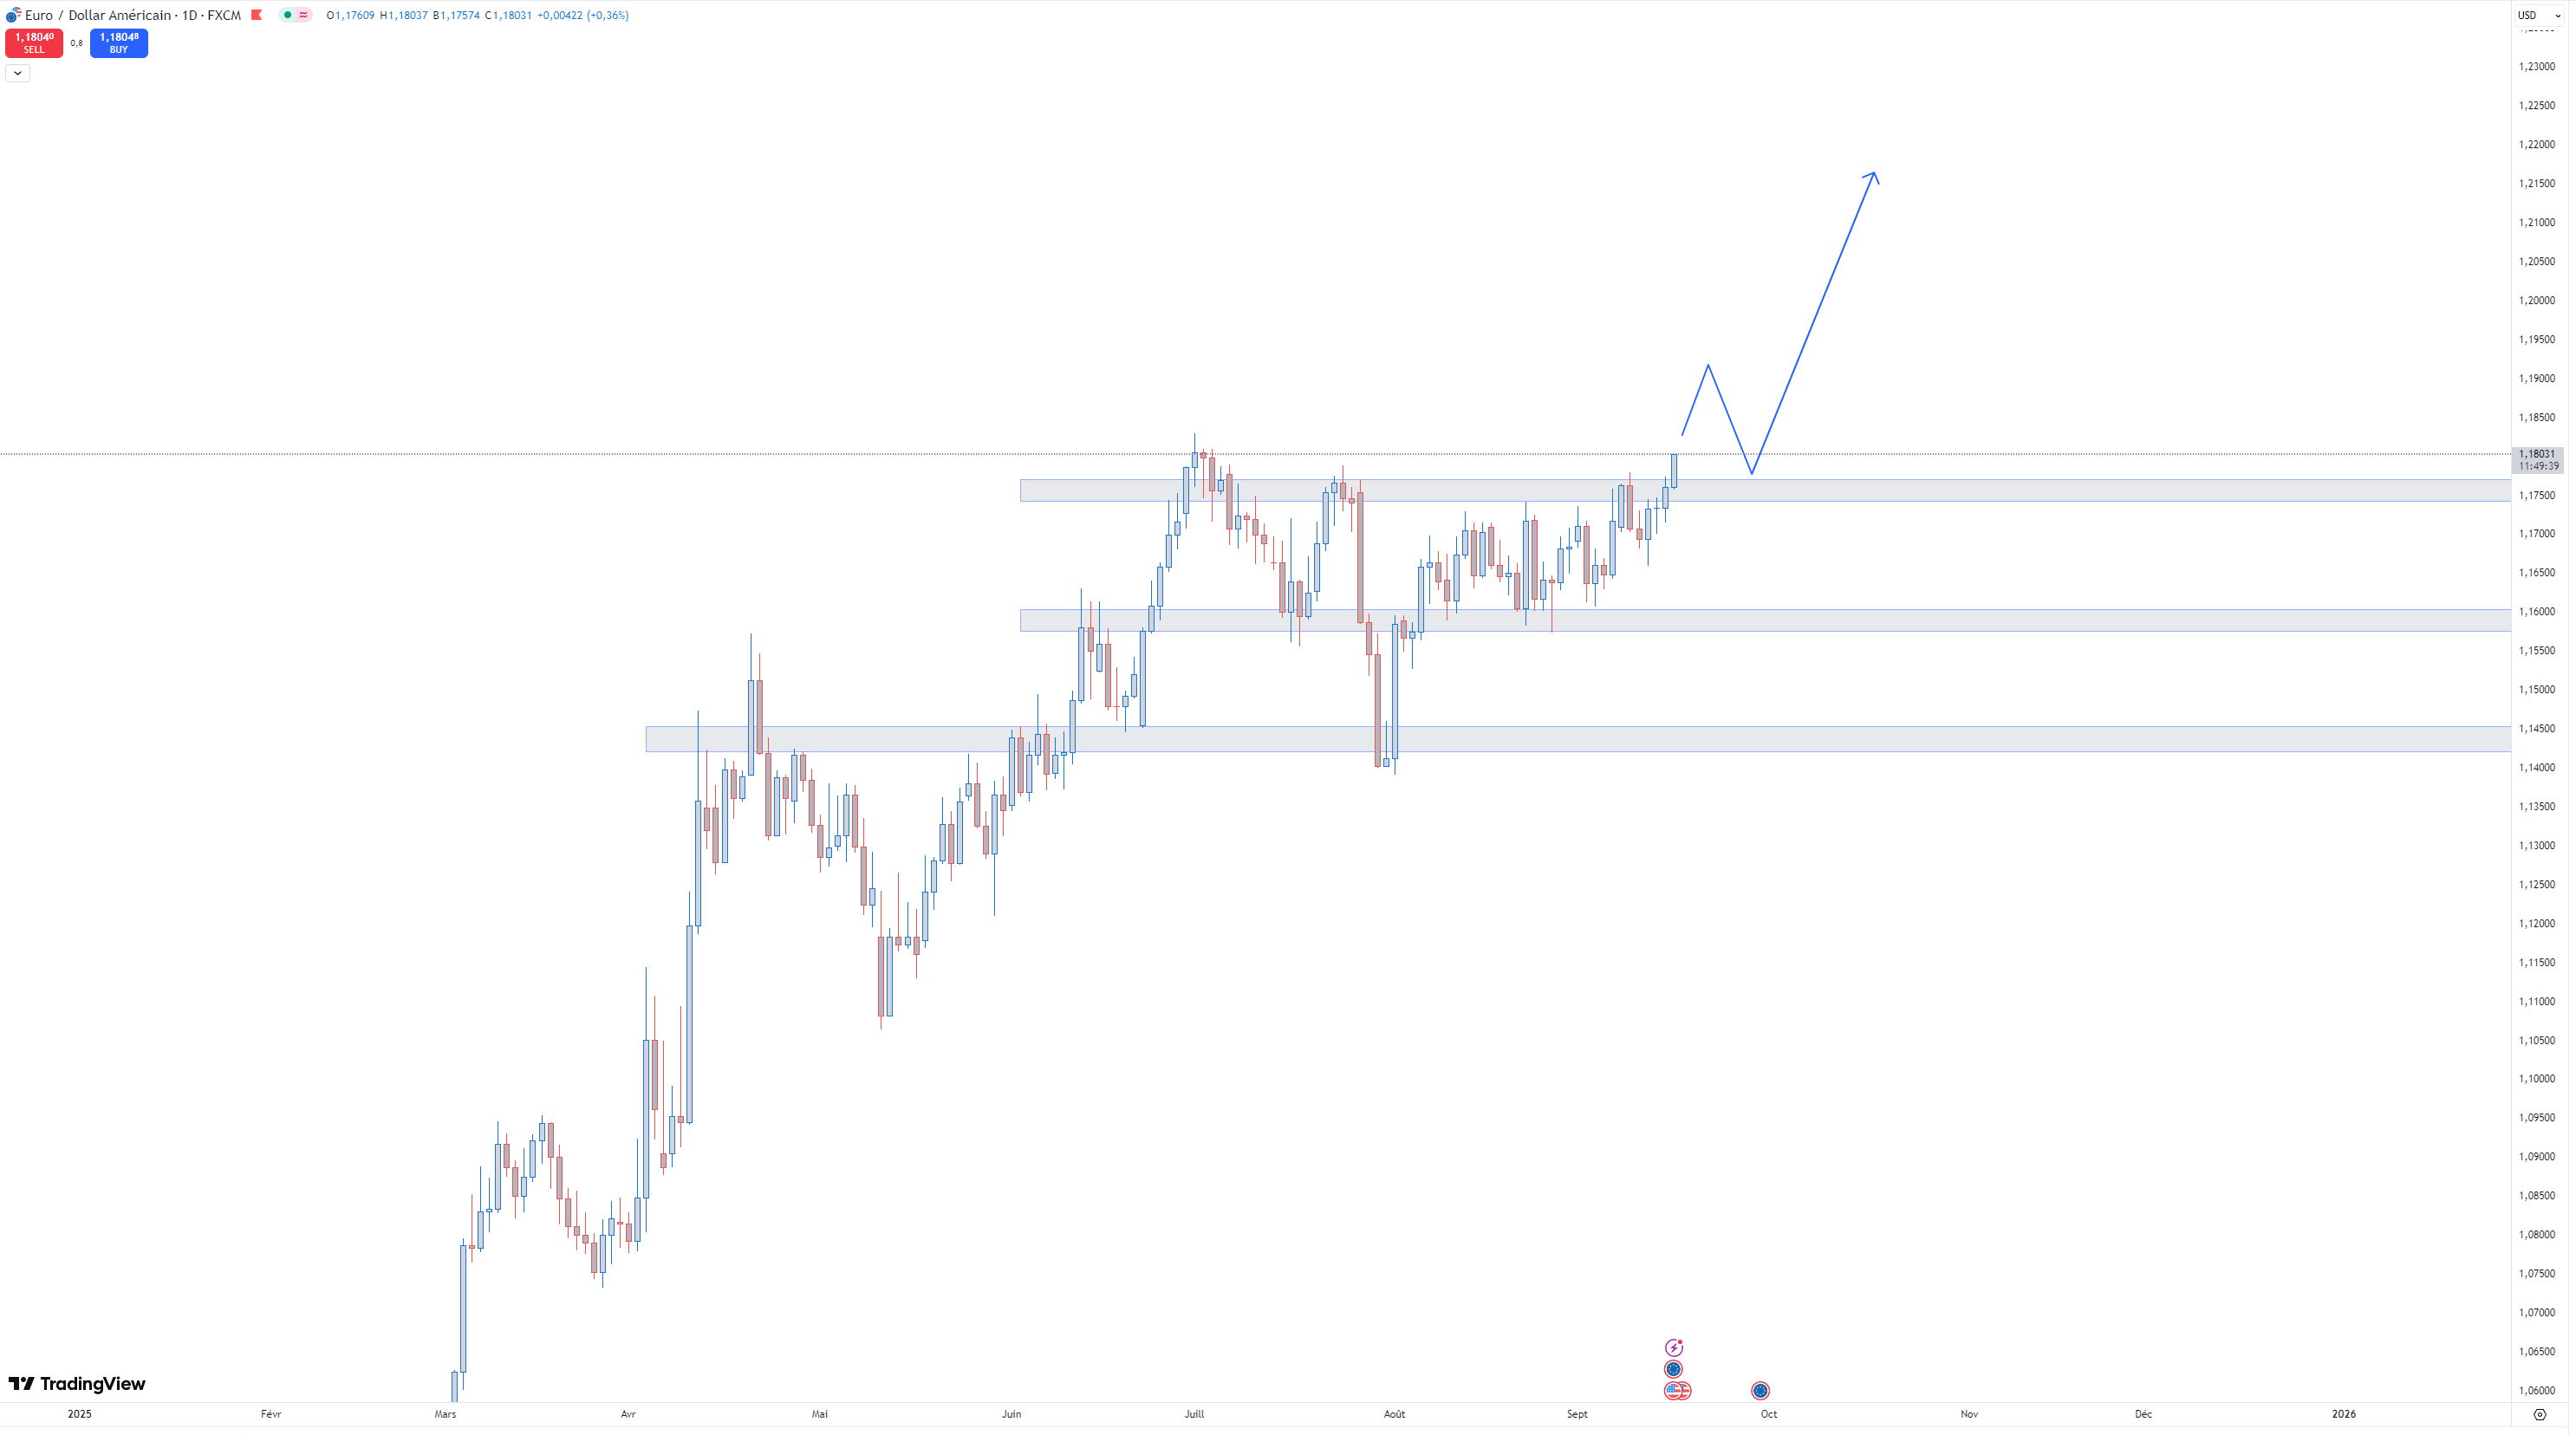
Daily : We can clearly see that there is a daily resistance right now, but the trend is bullish.
Again, it would have been safer to wait for the resistance to break.


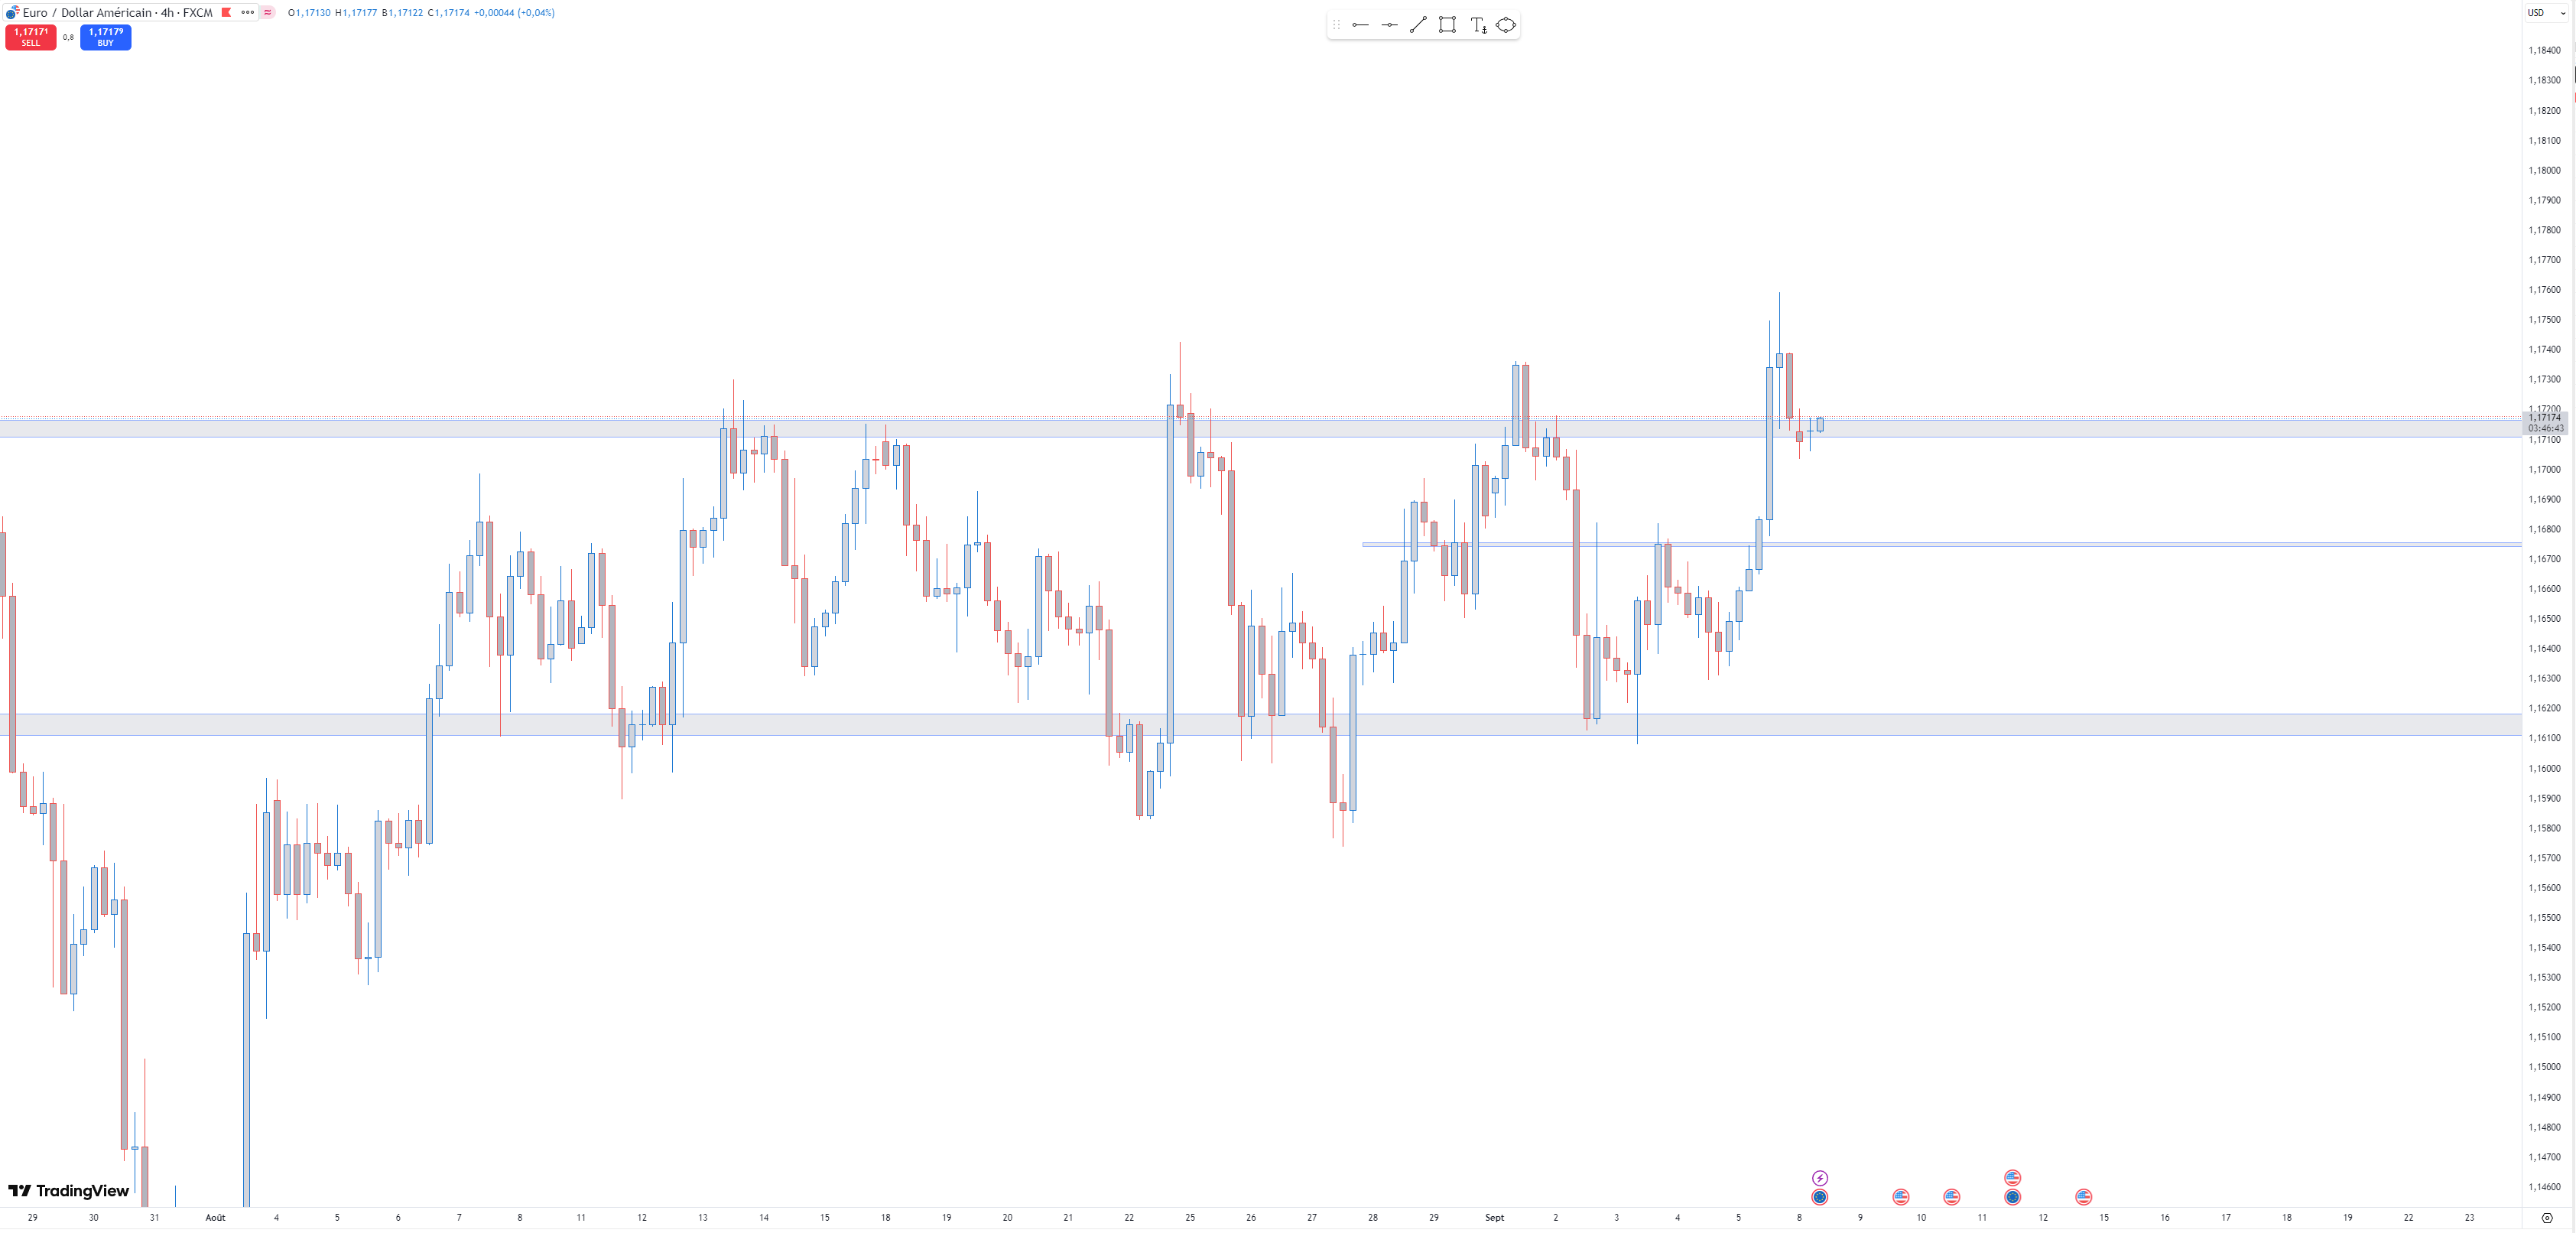
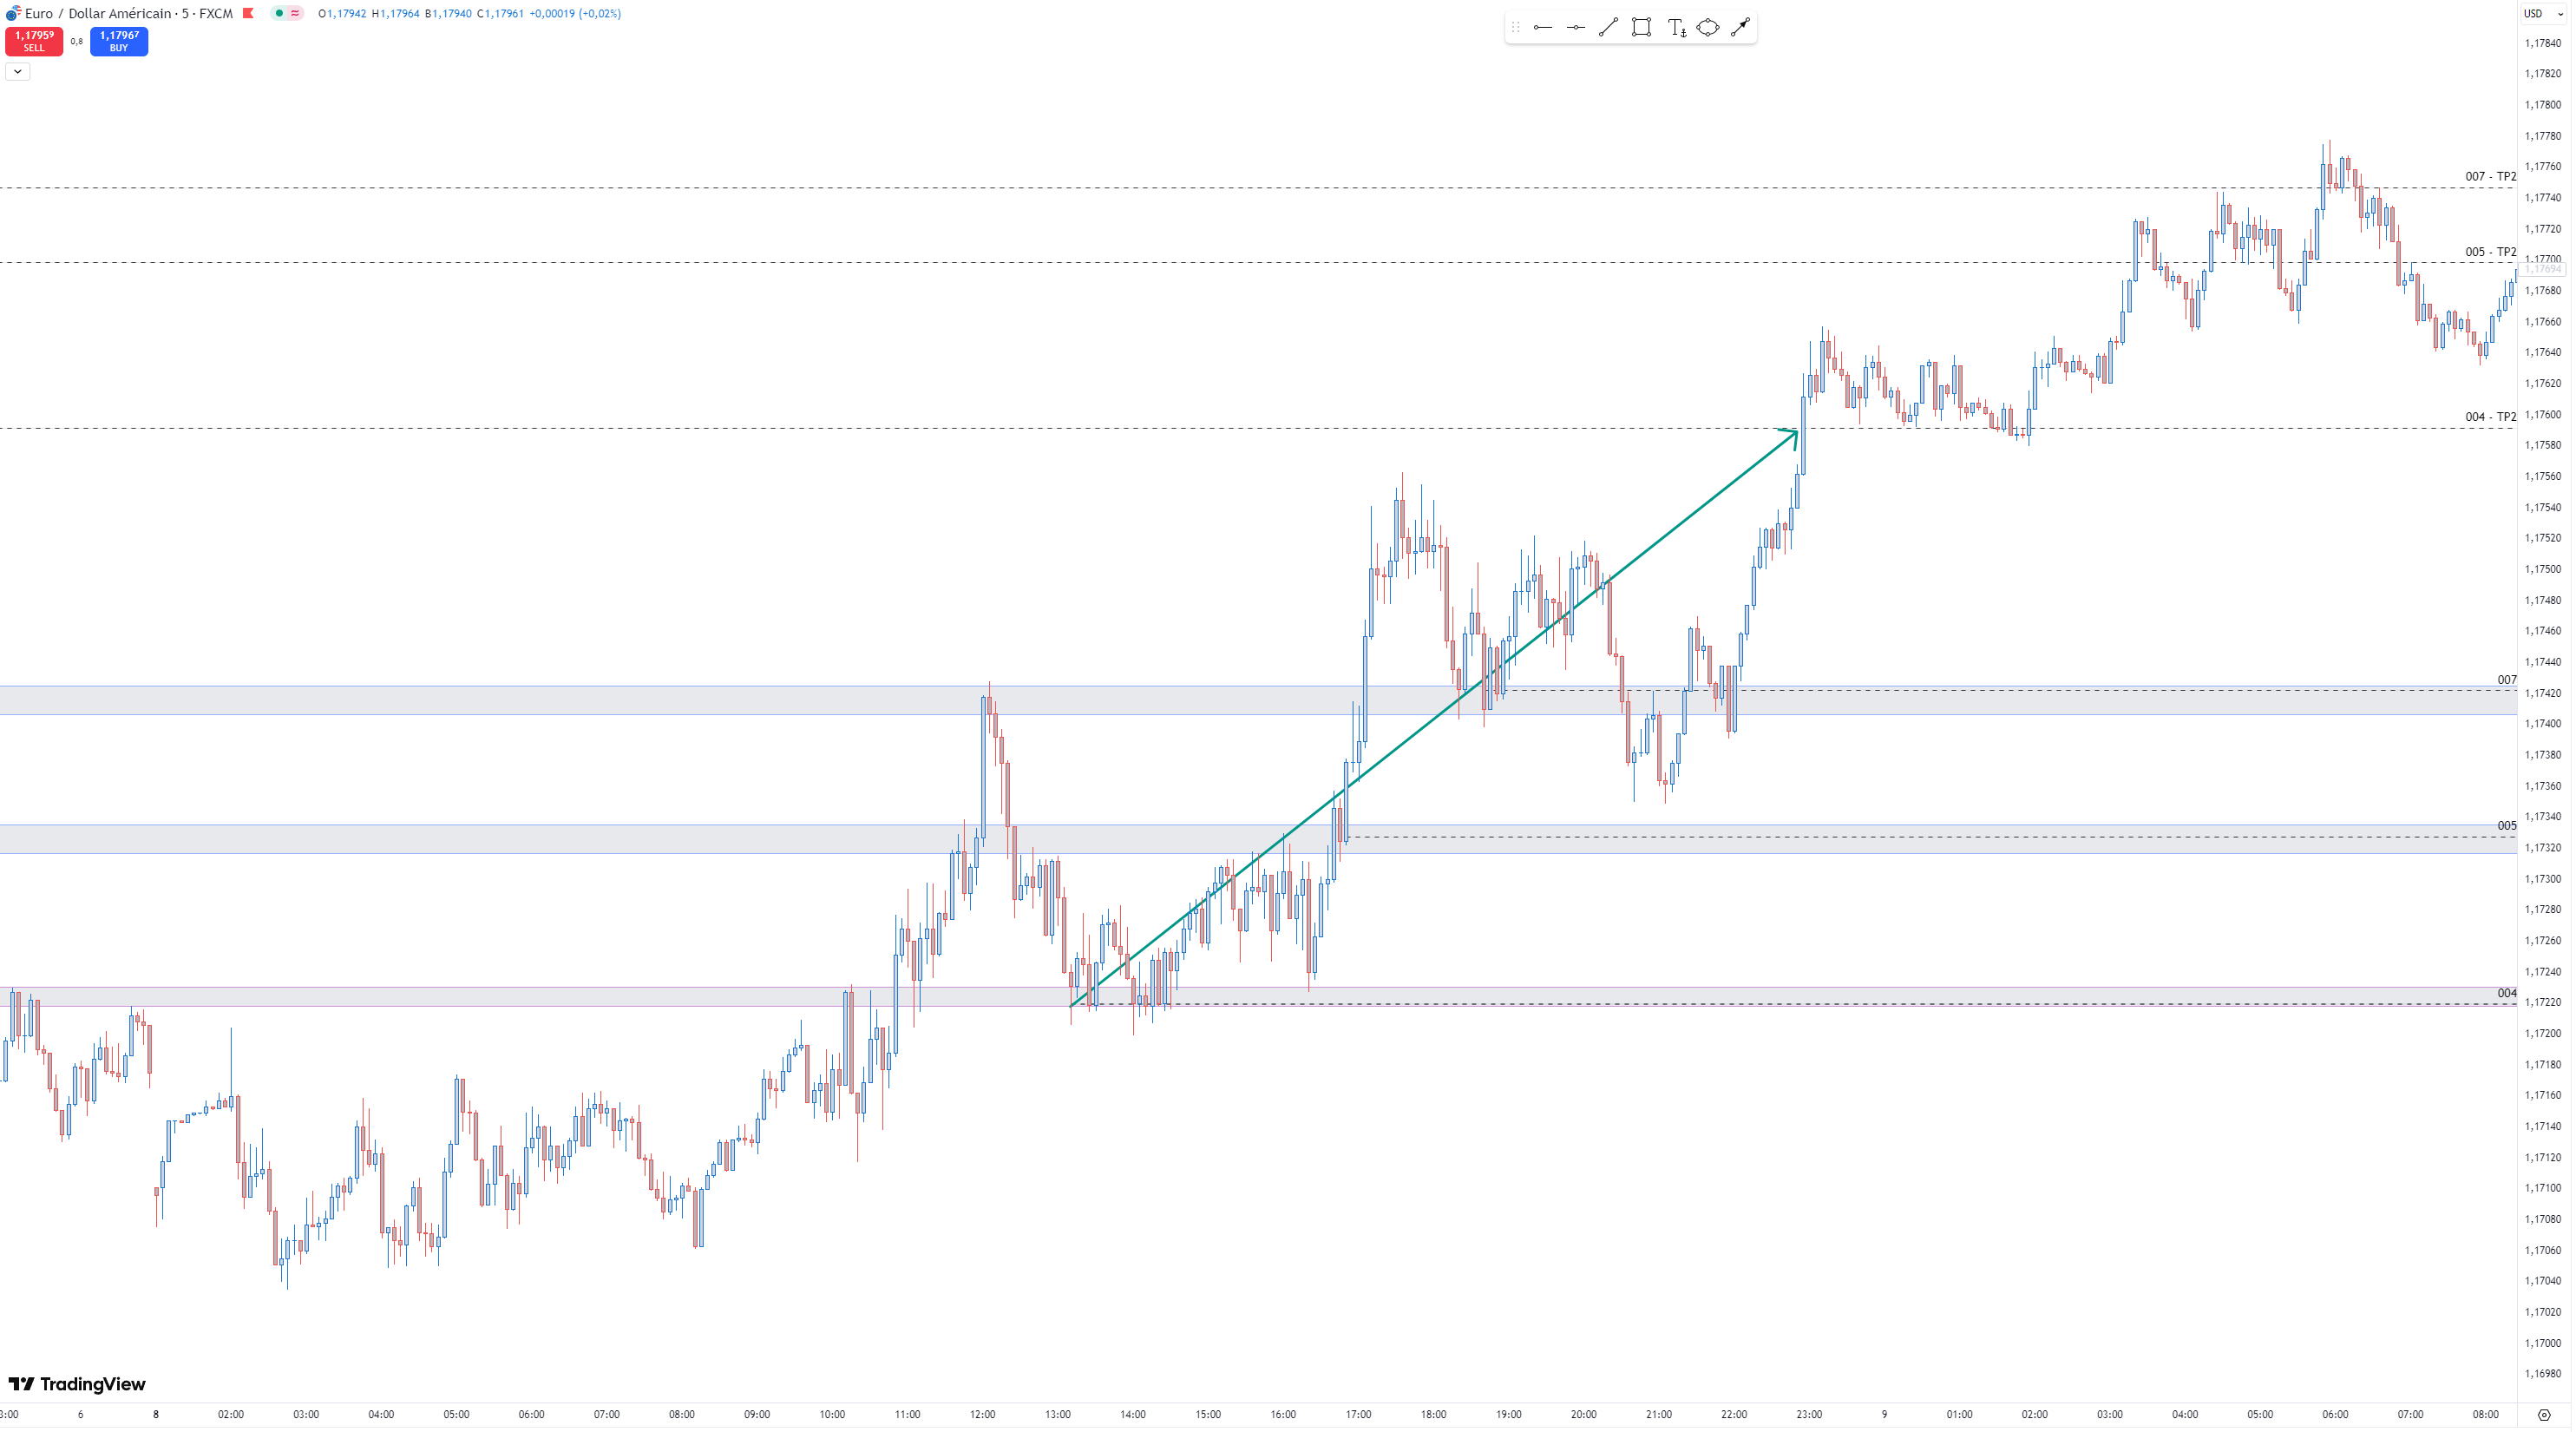
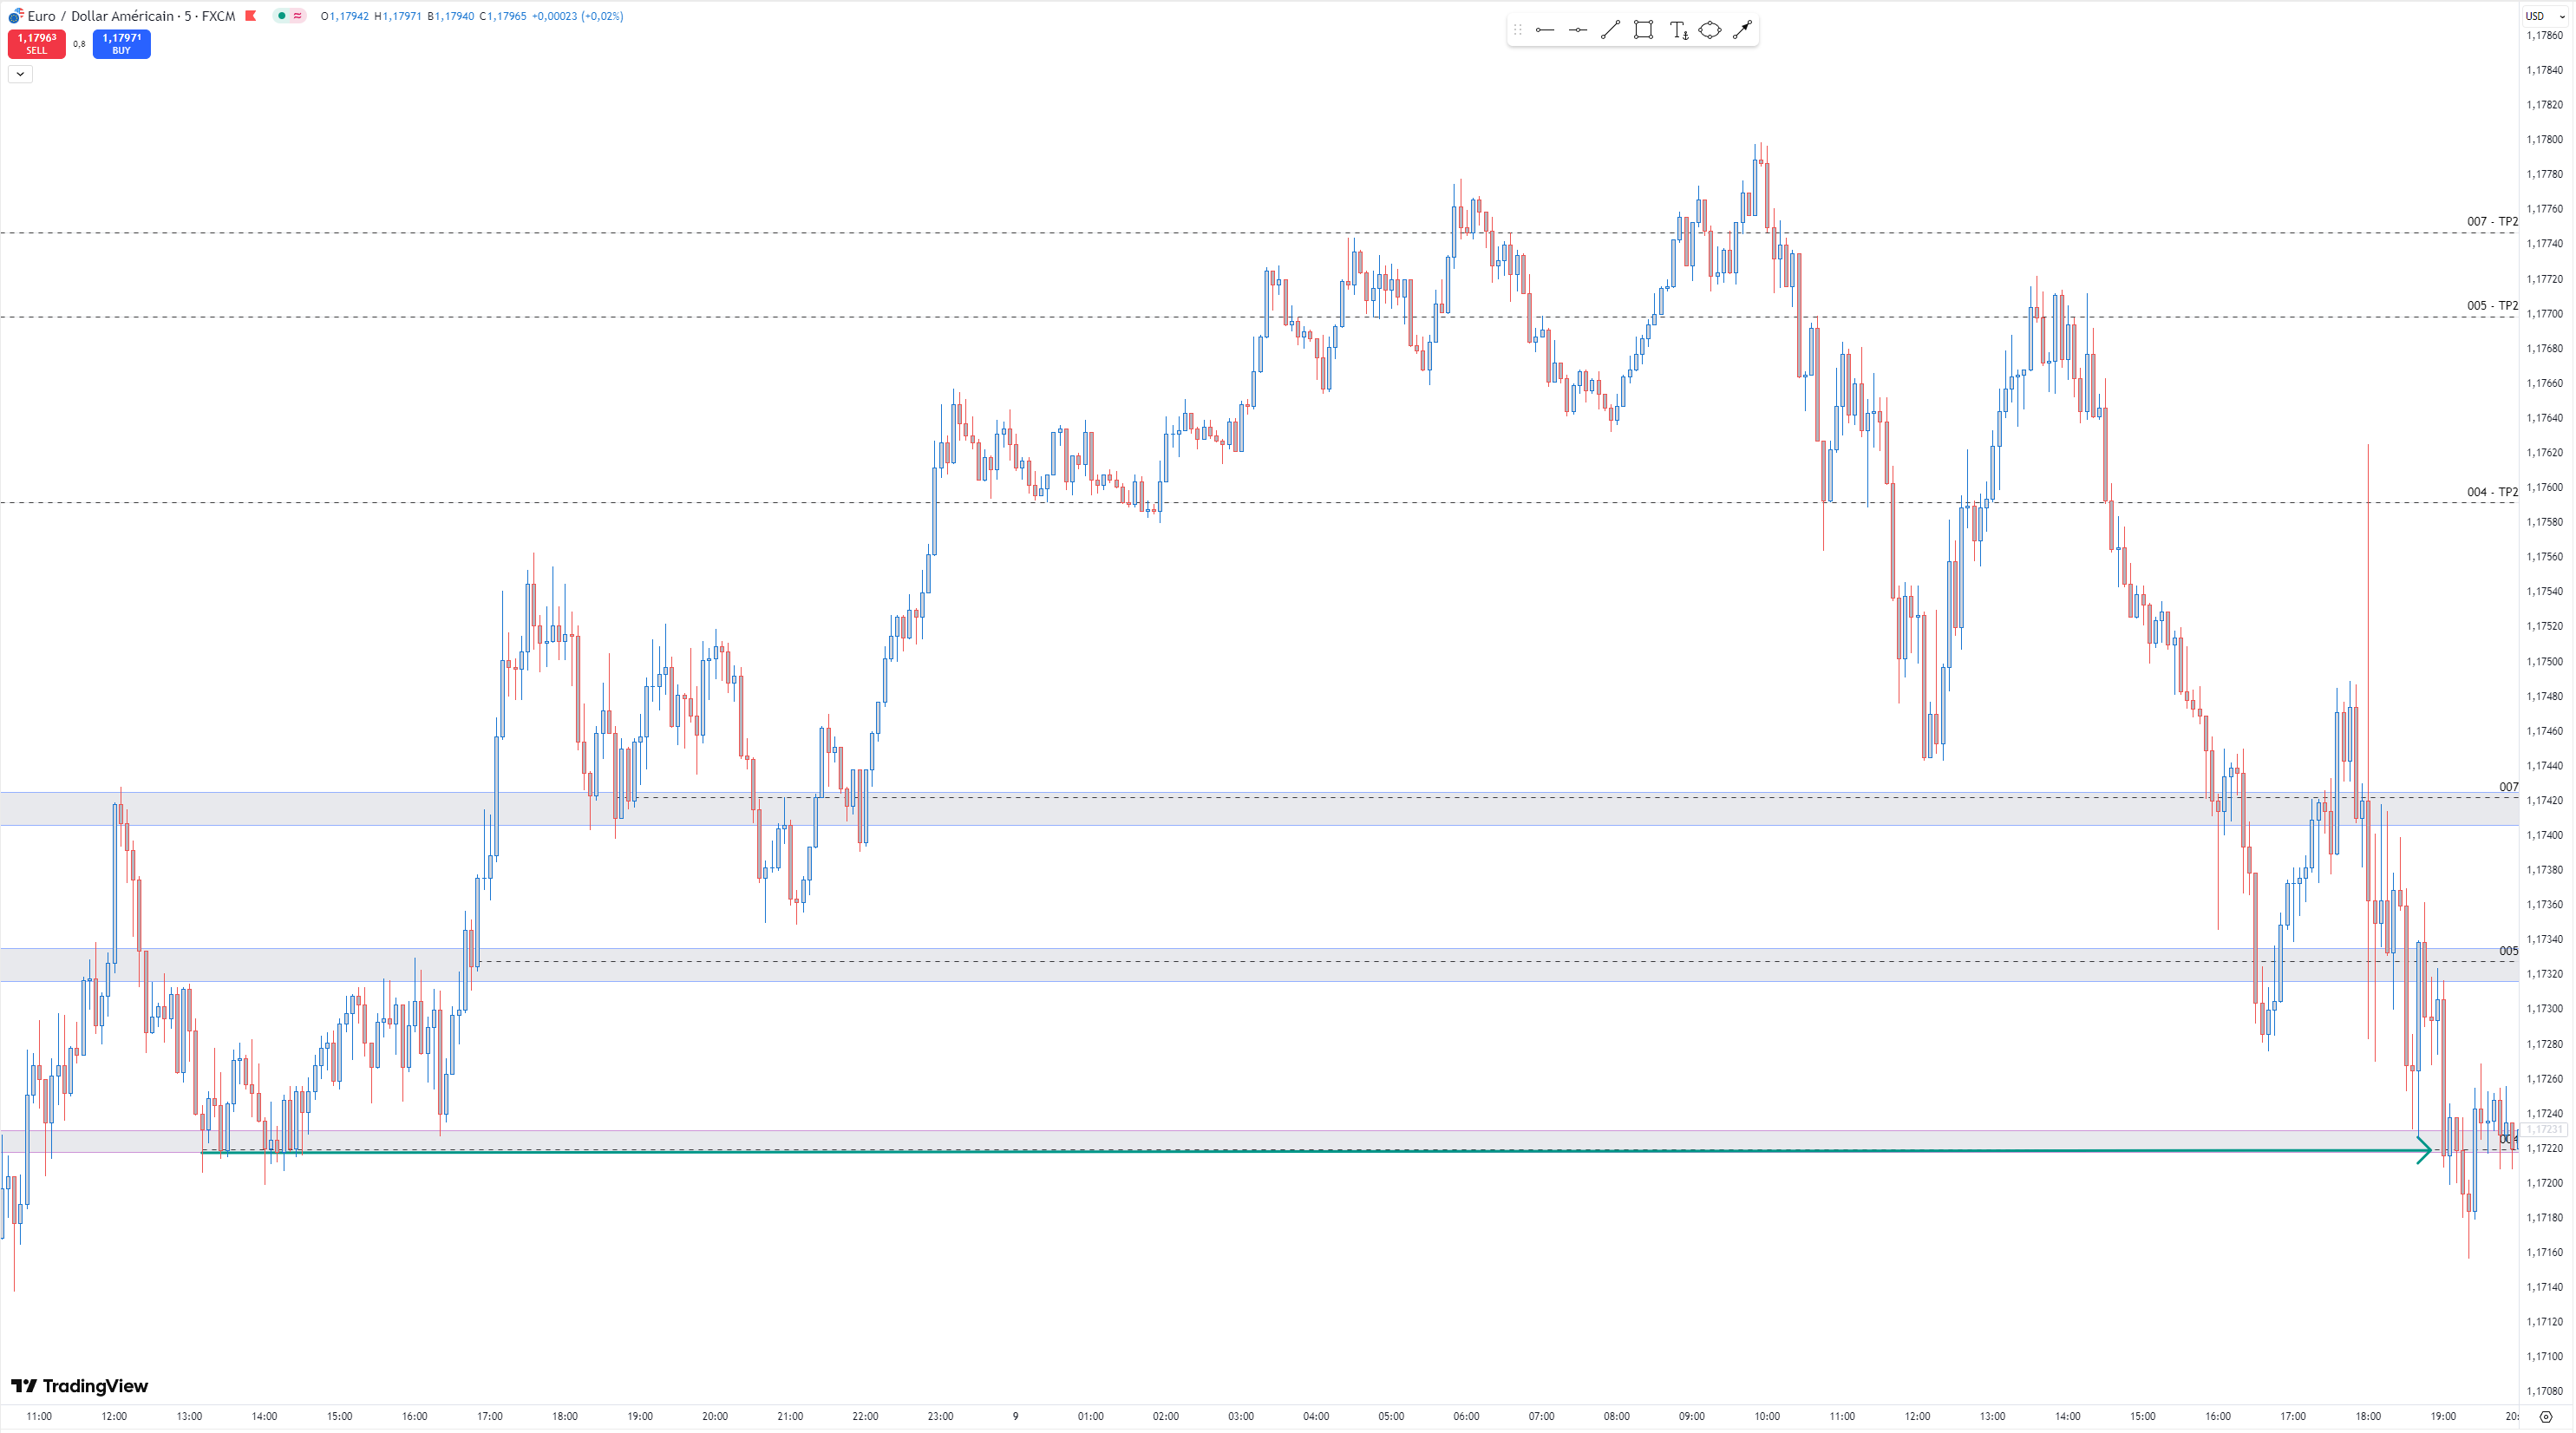
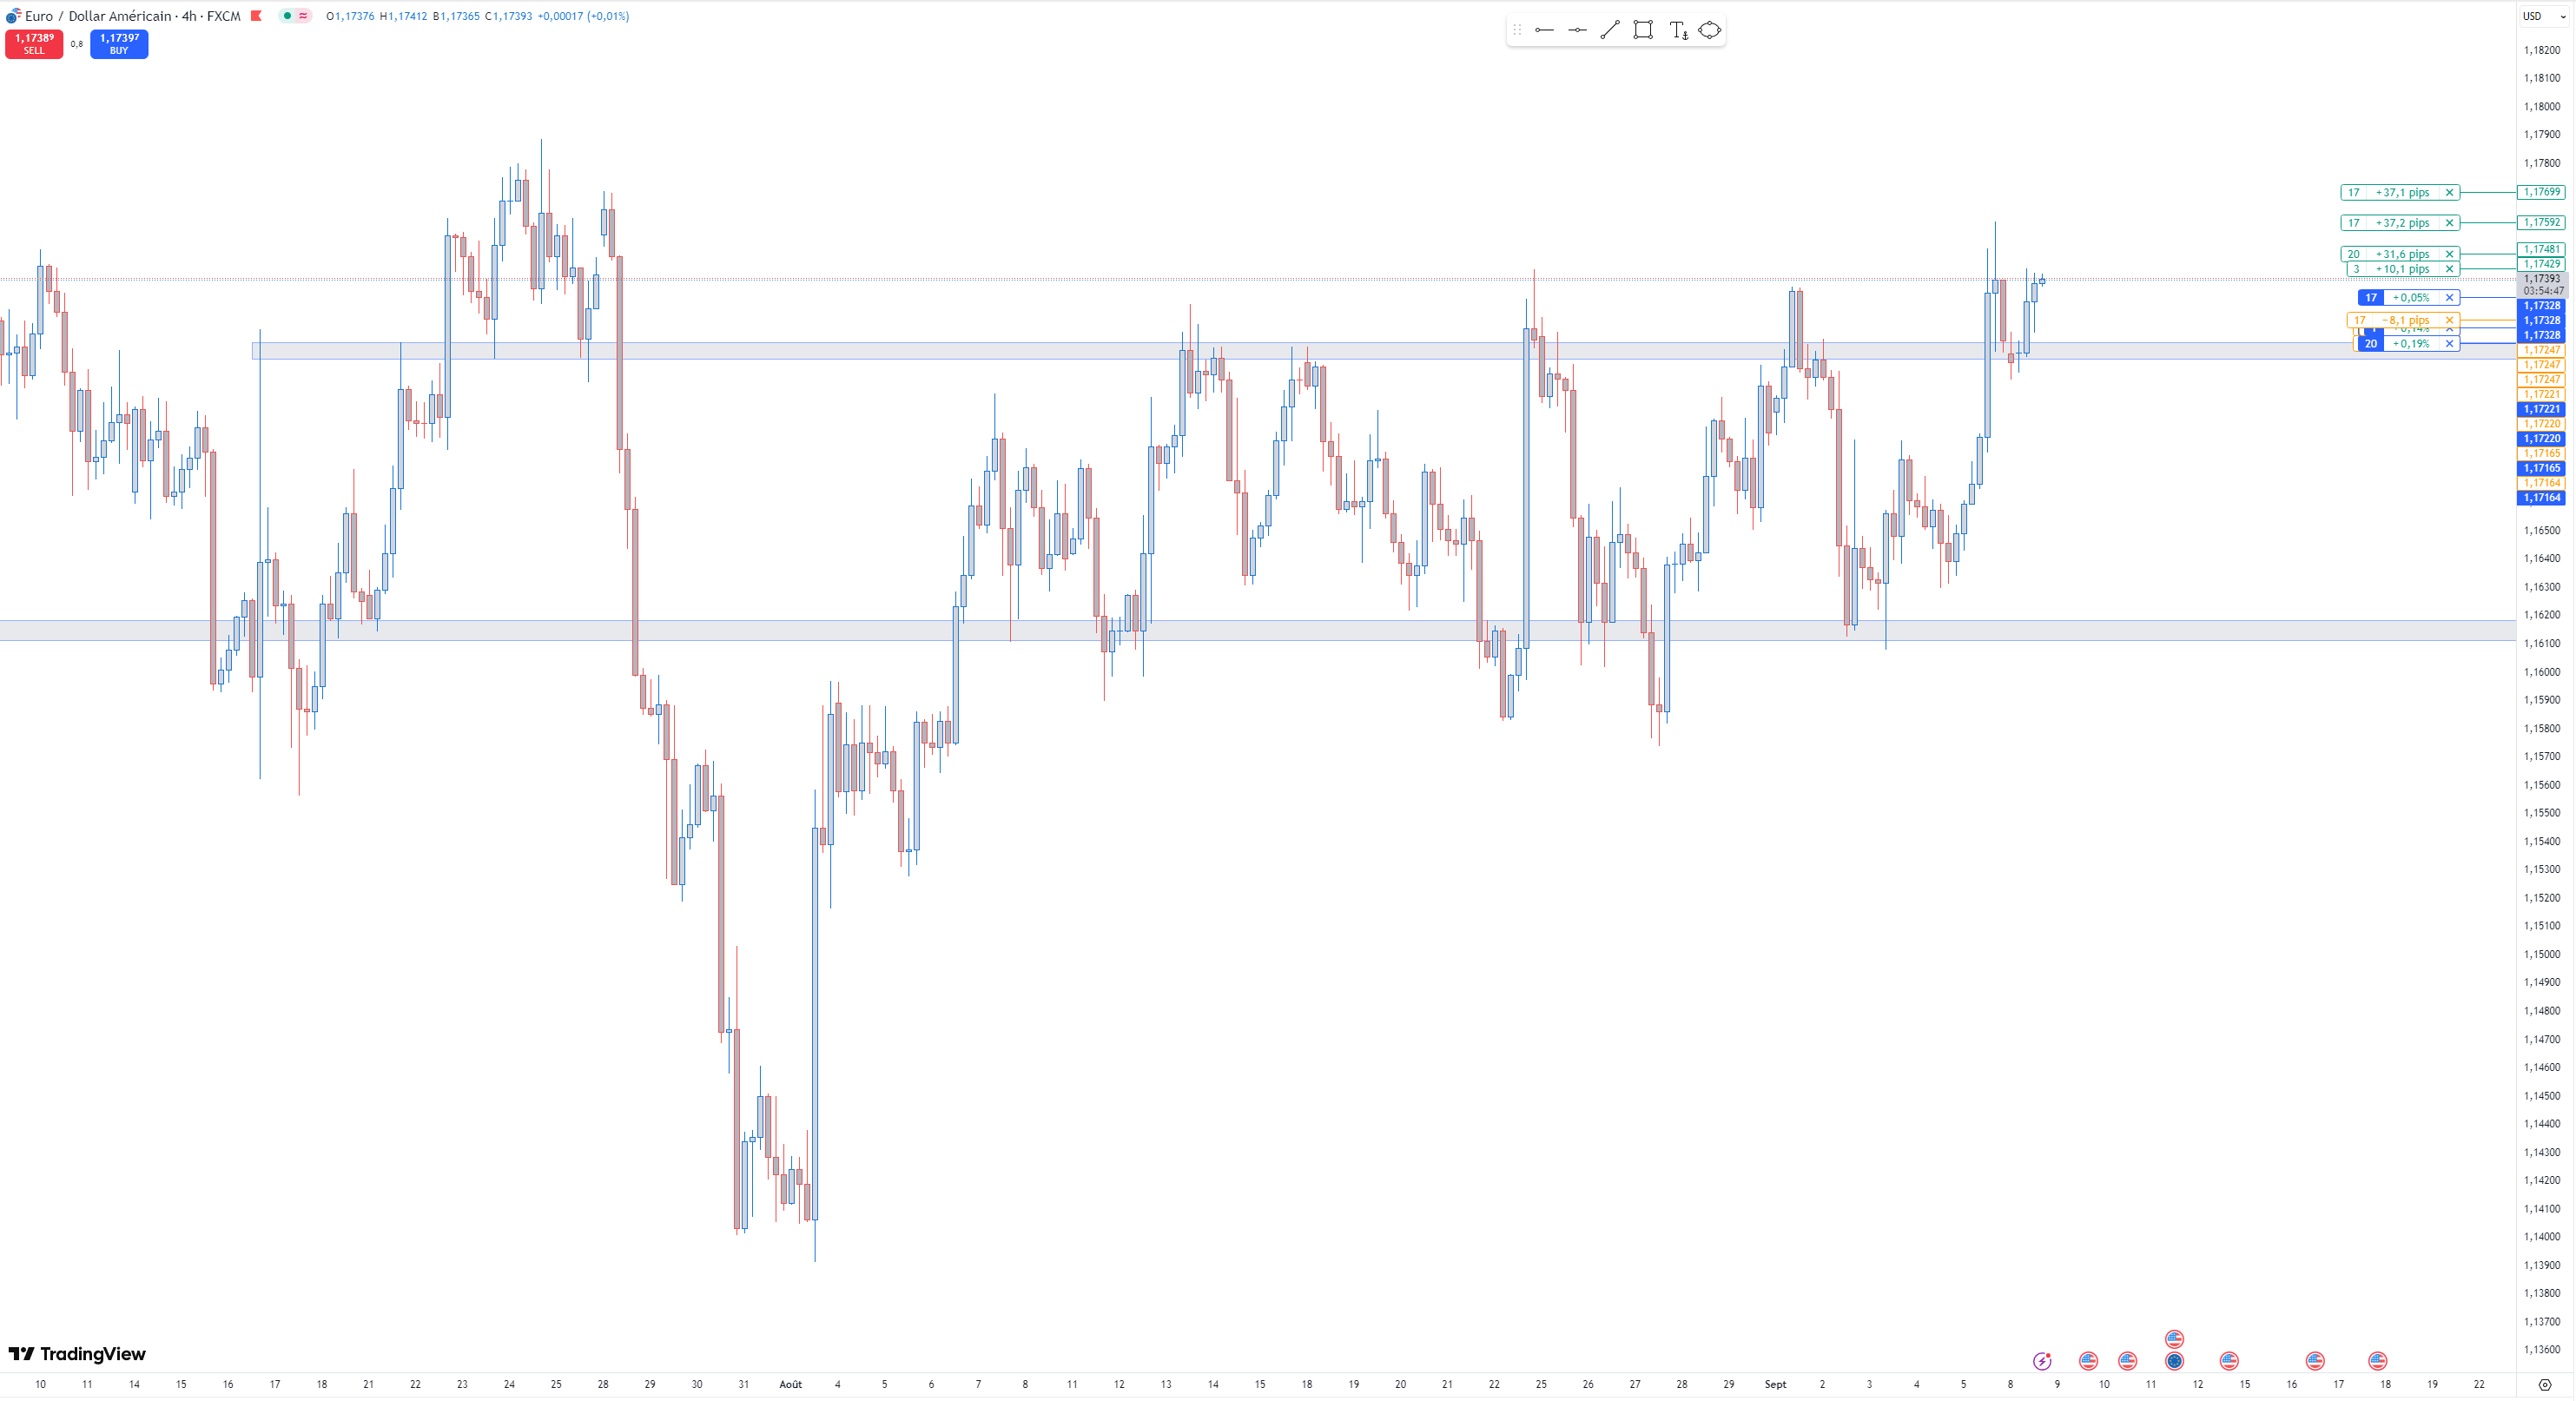
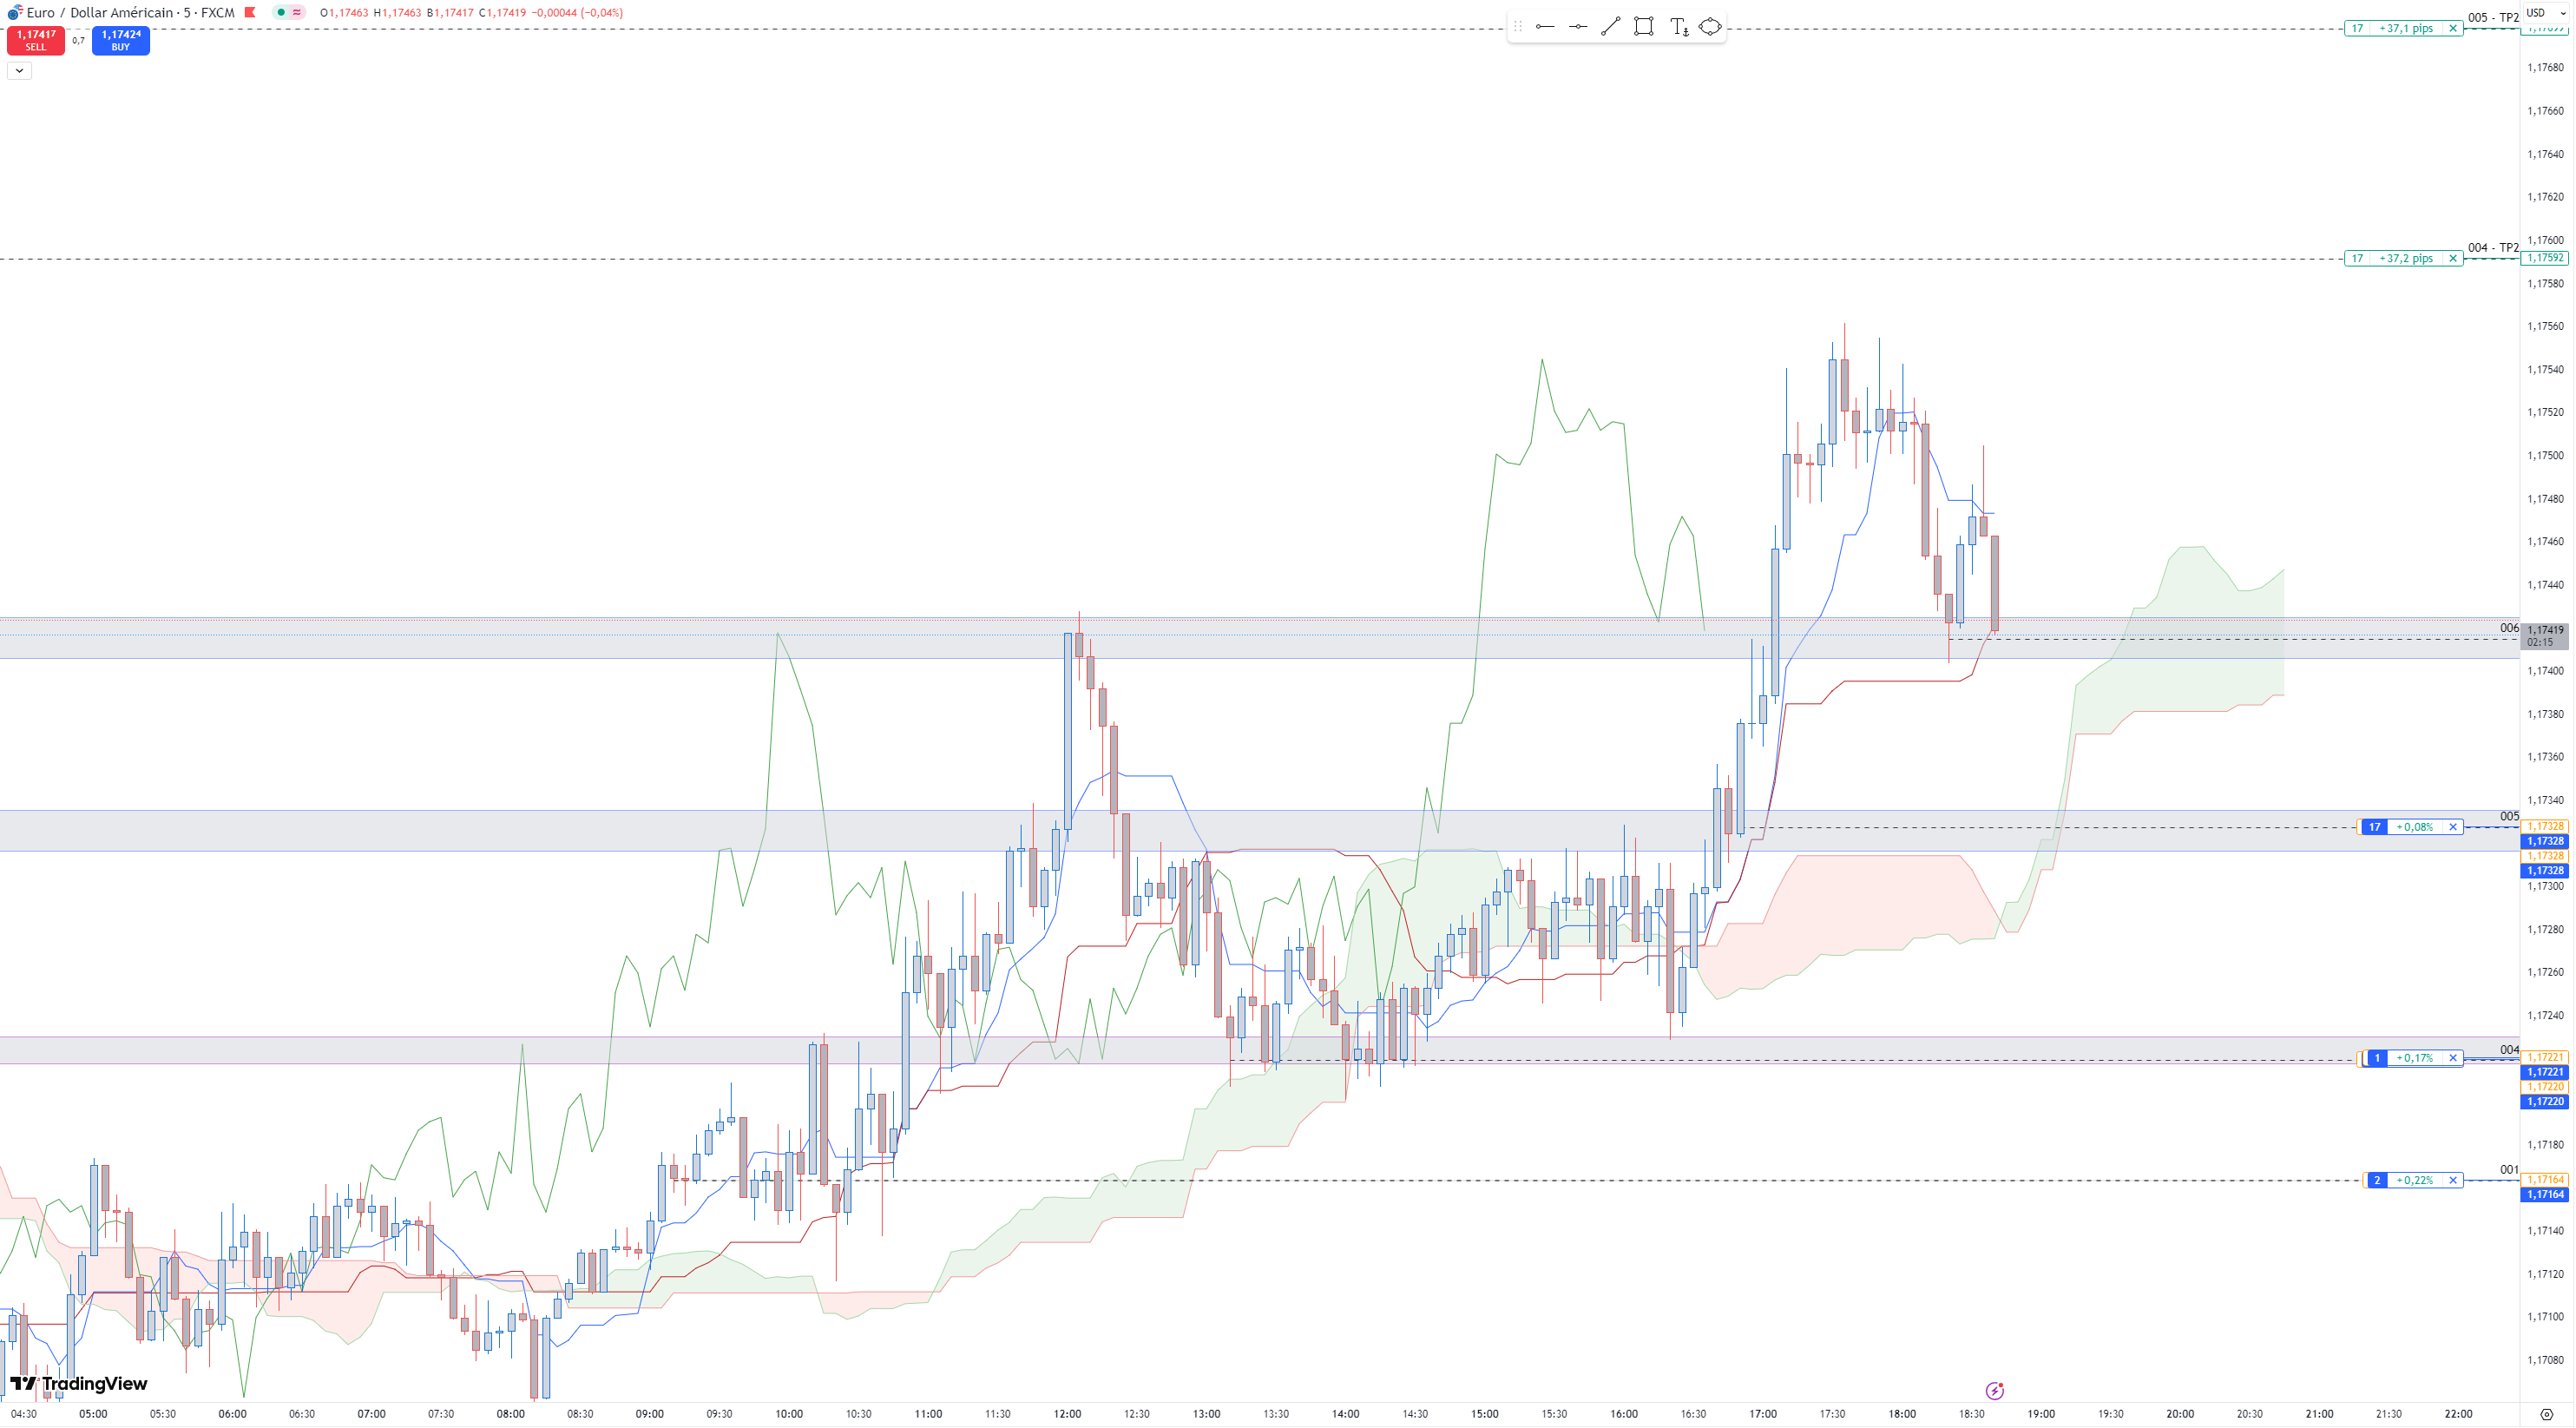
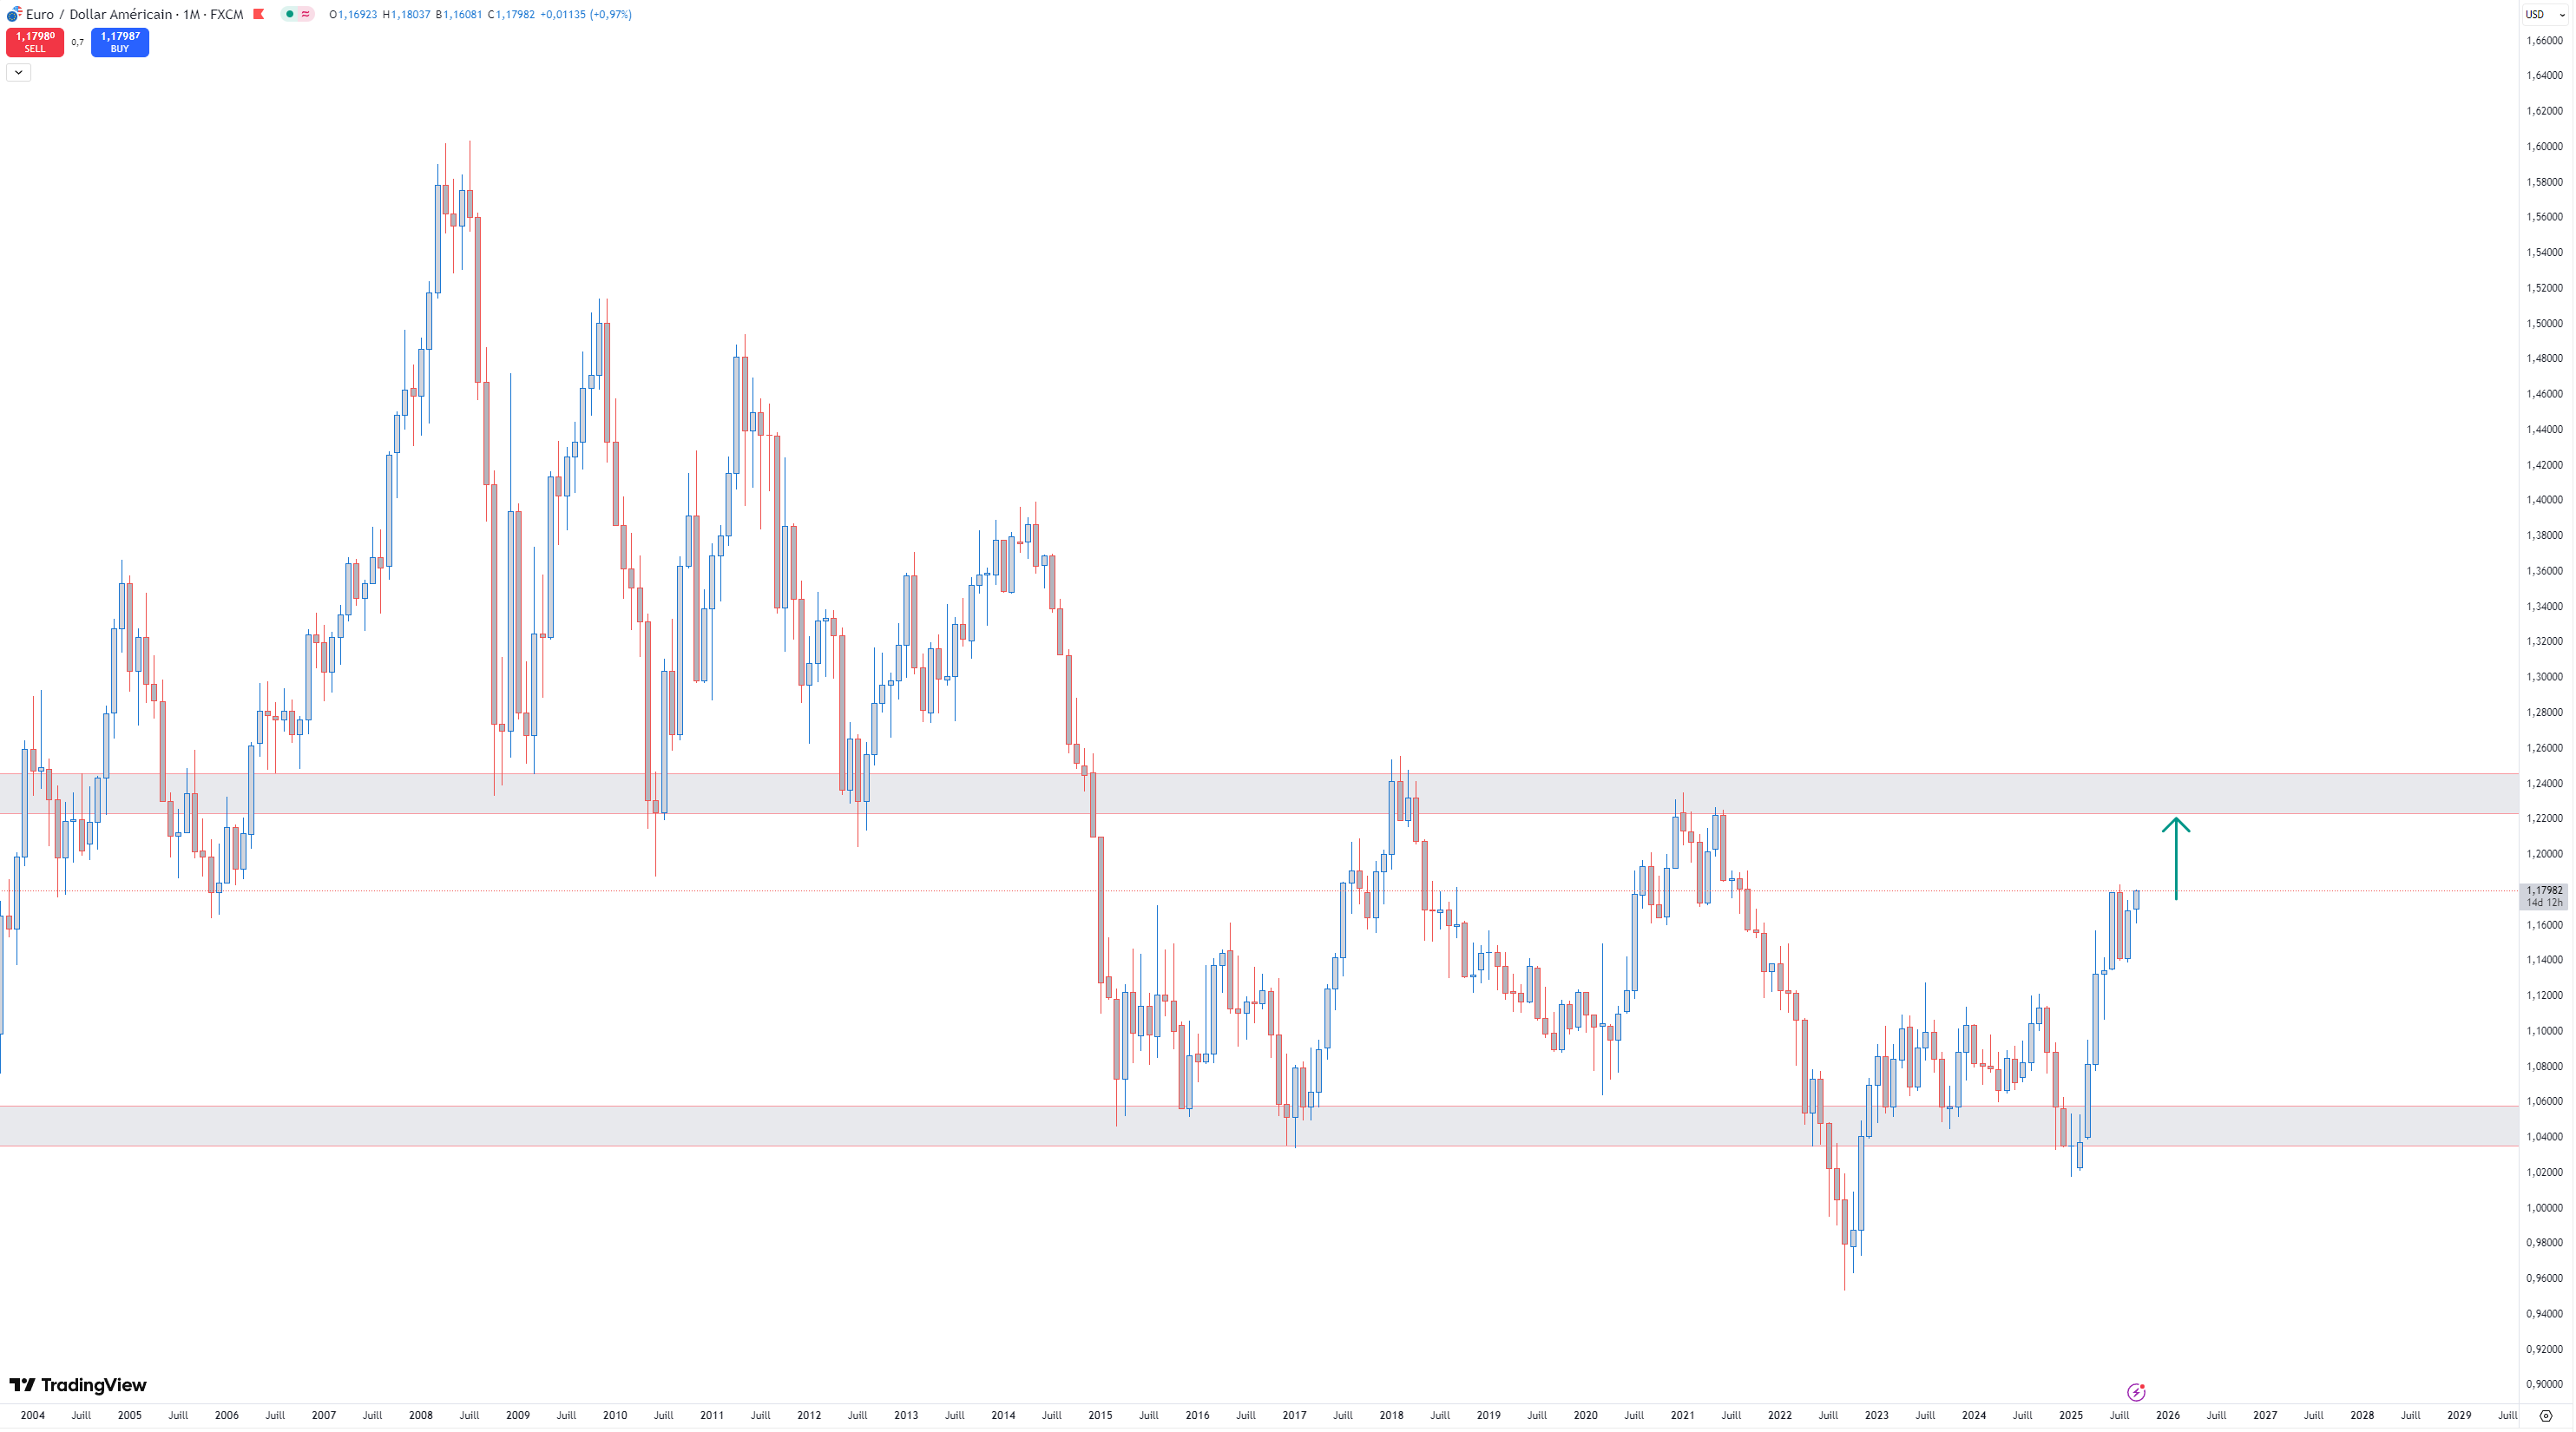
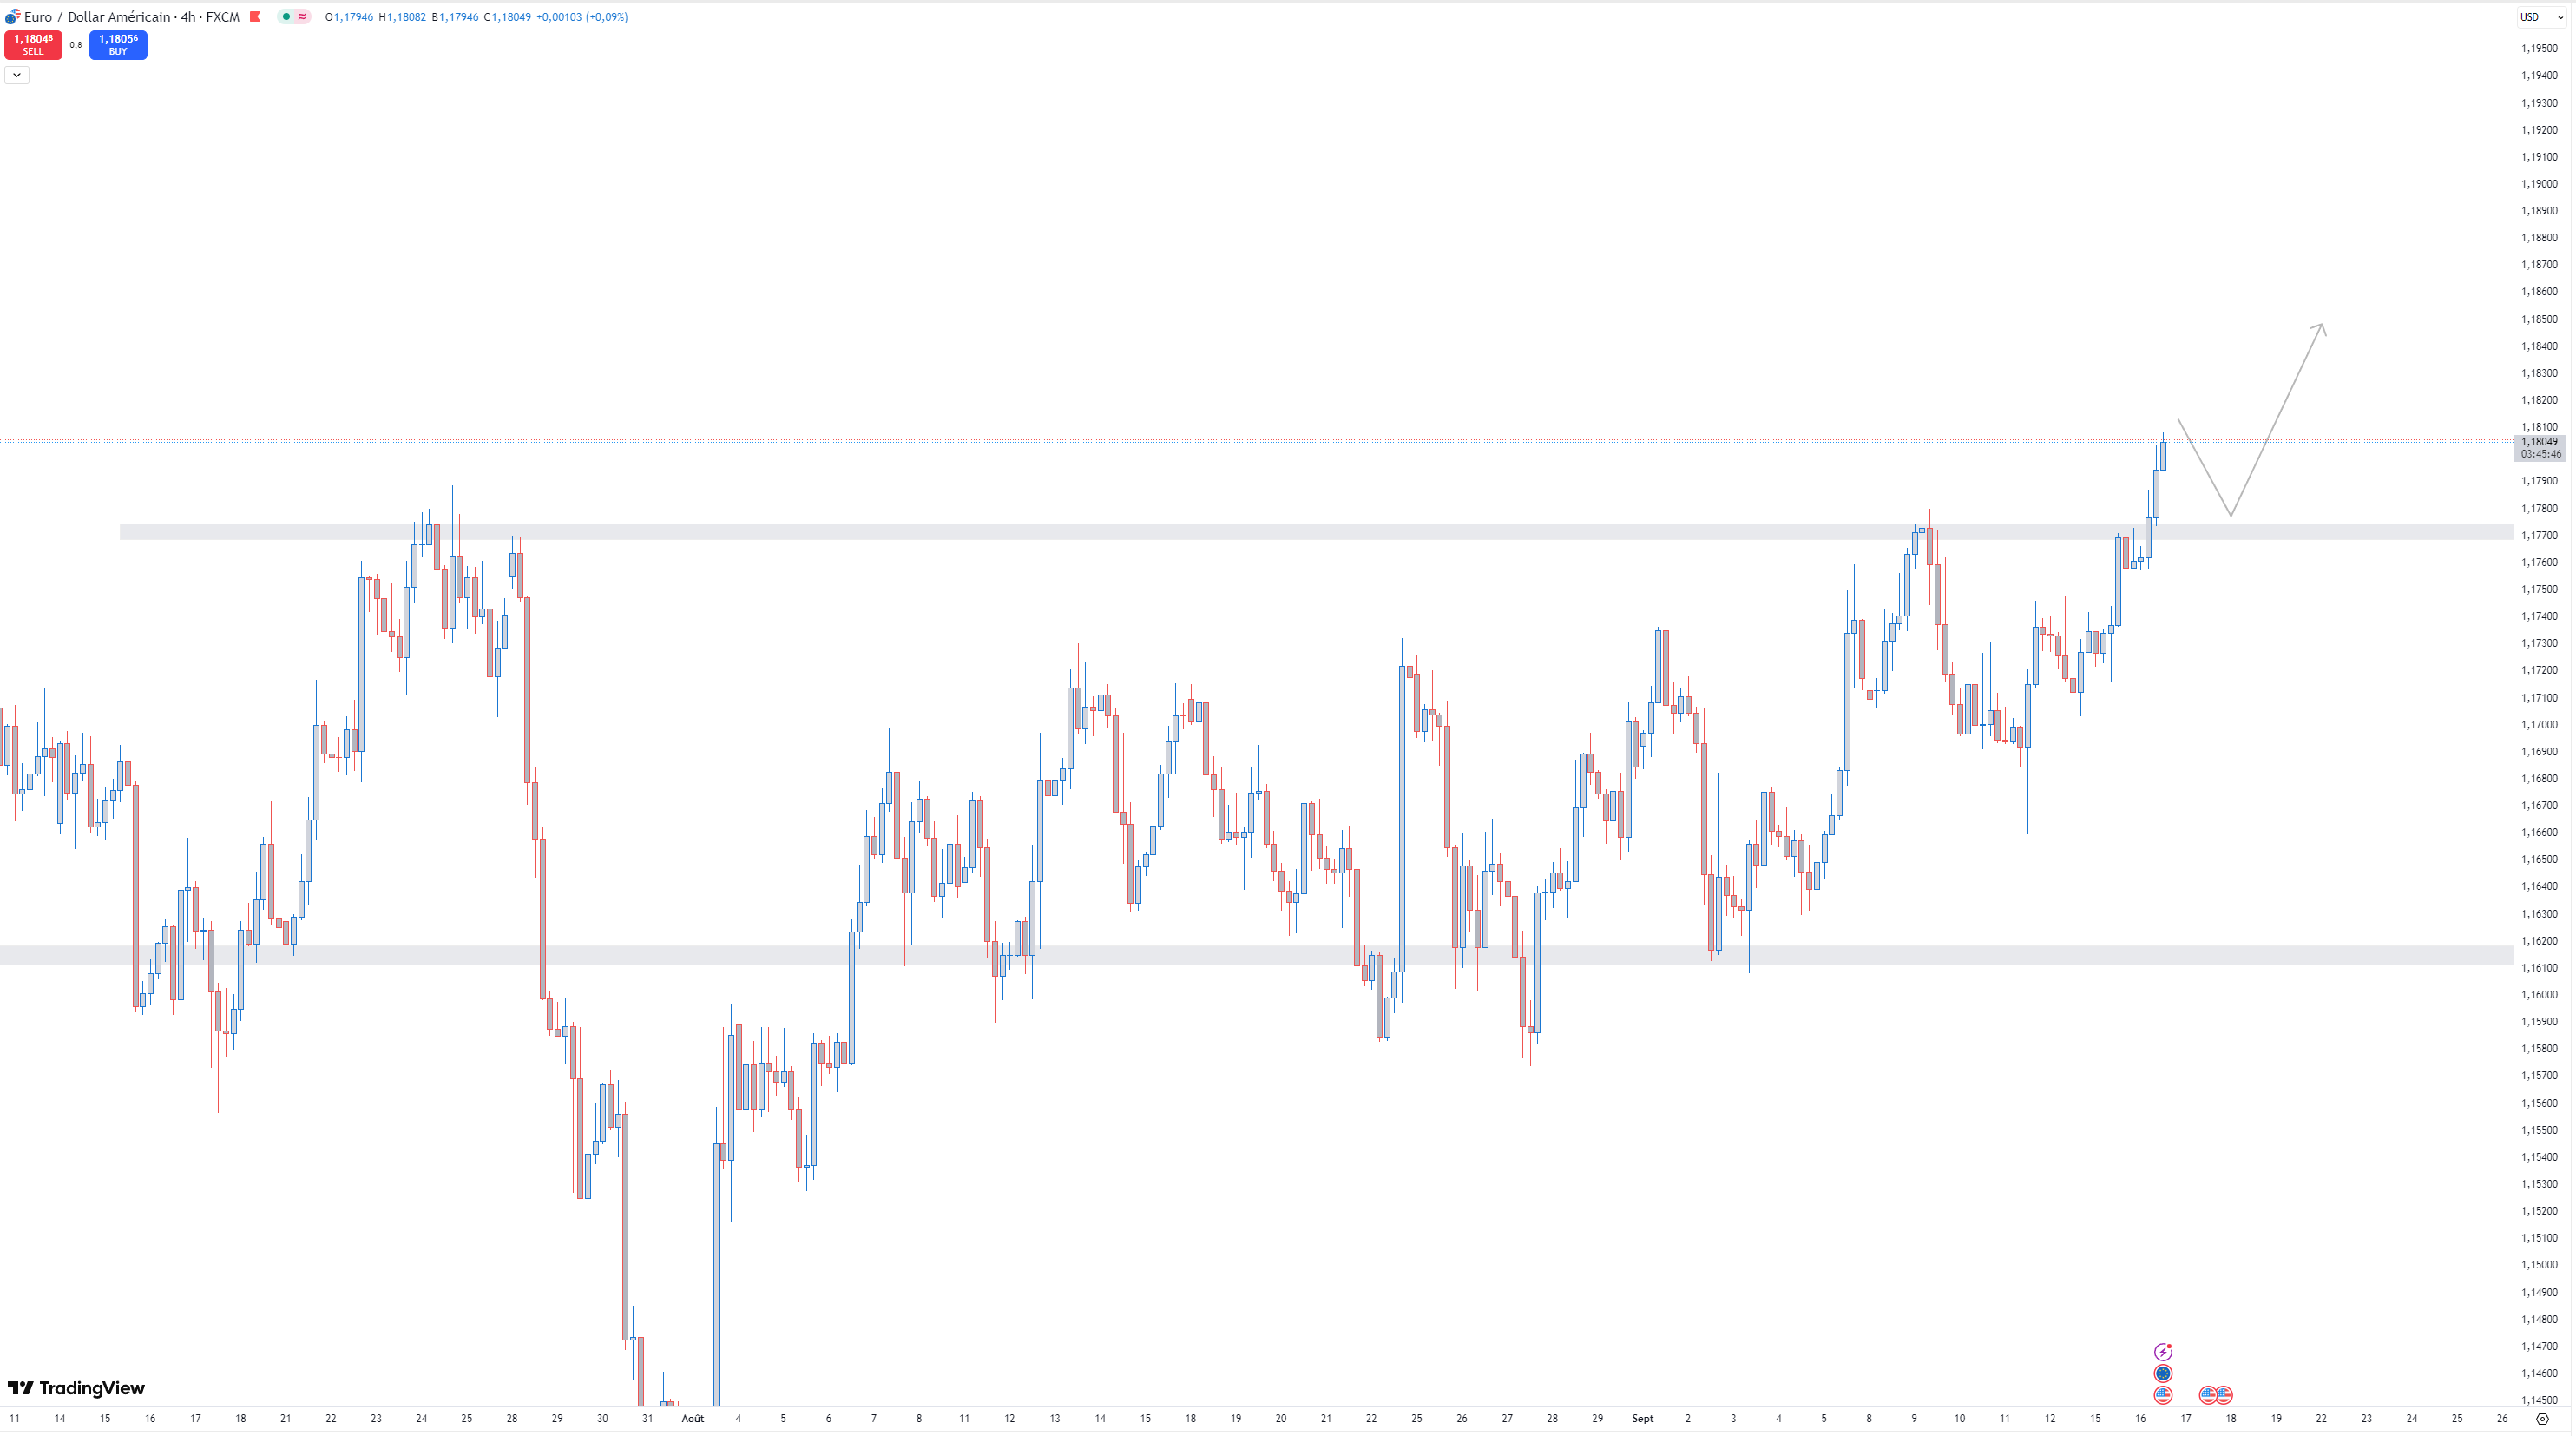
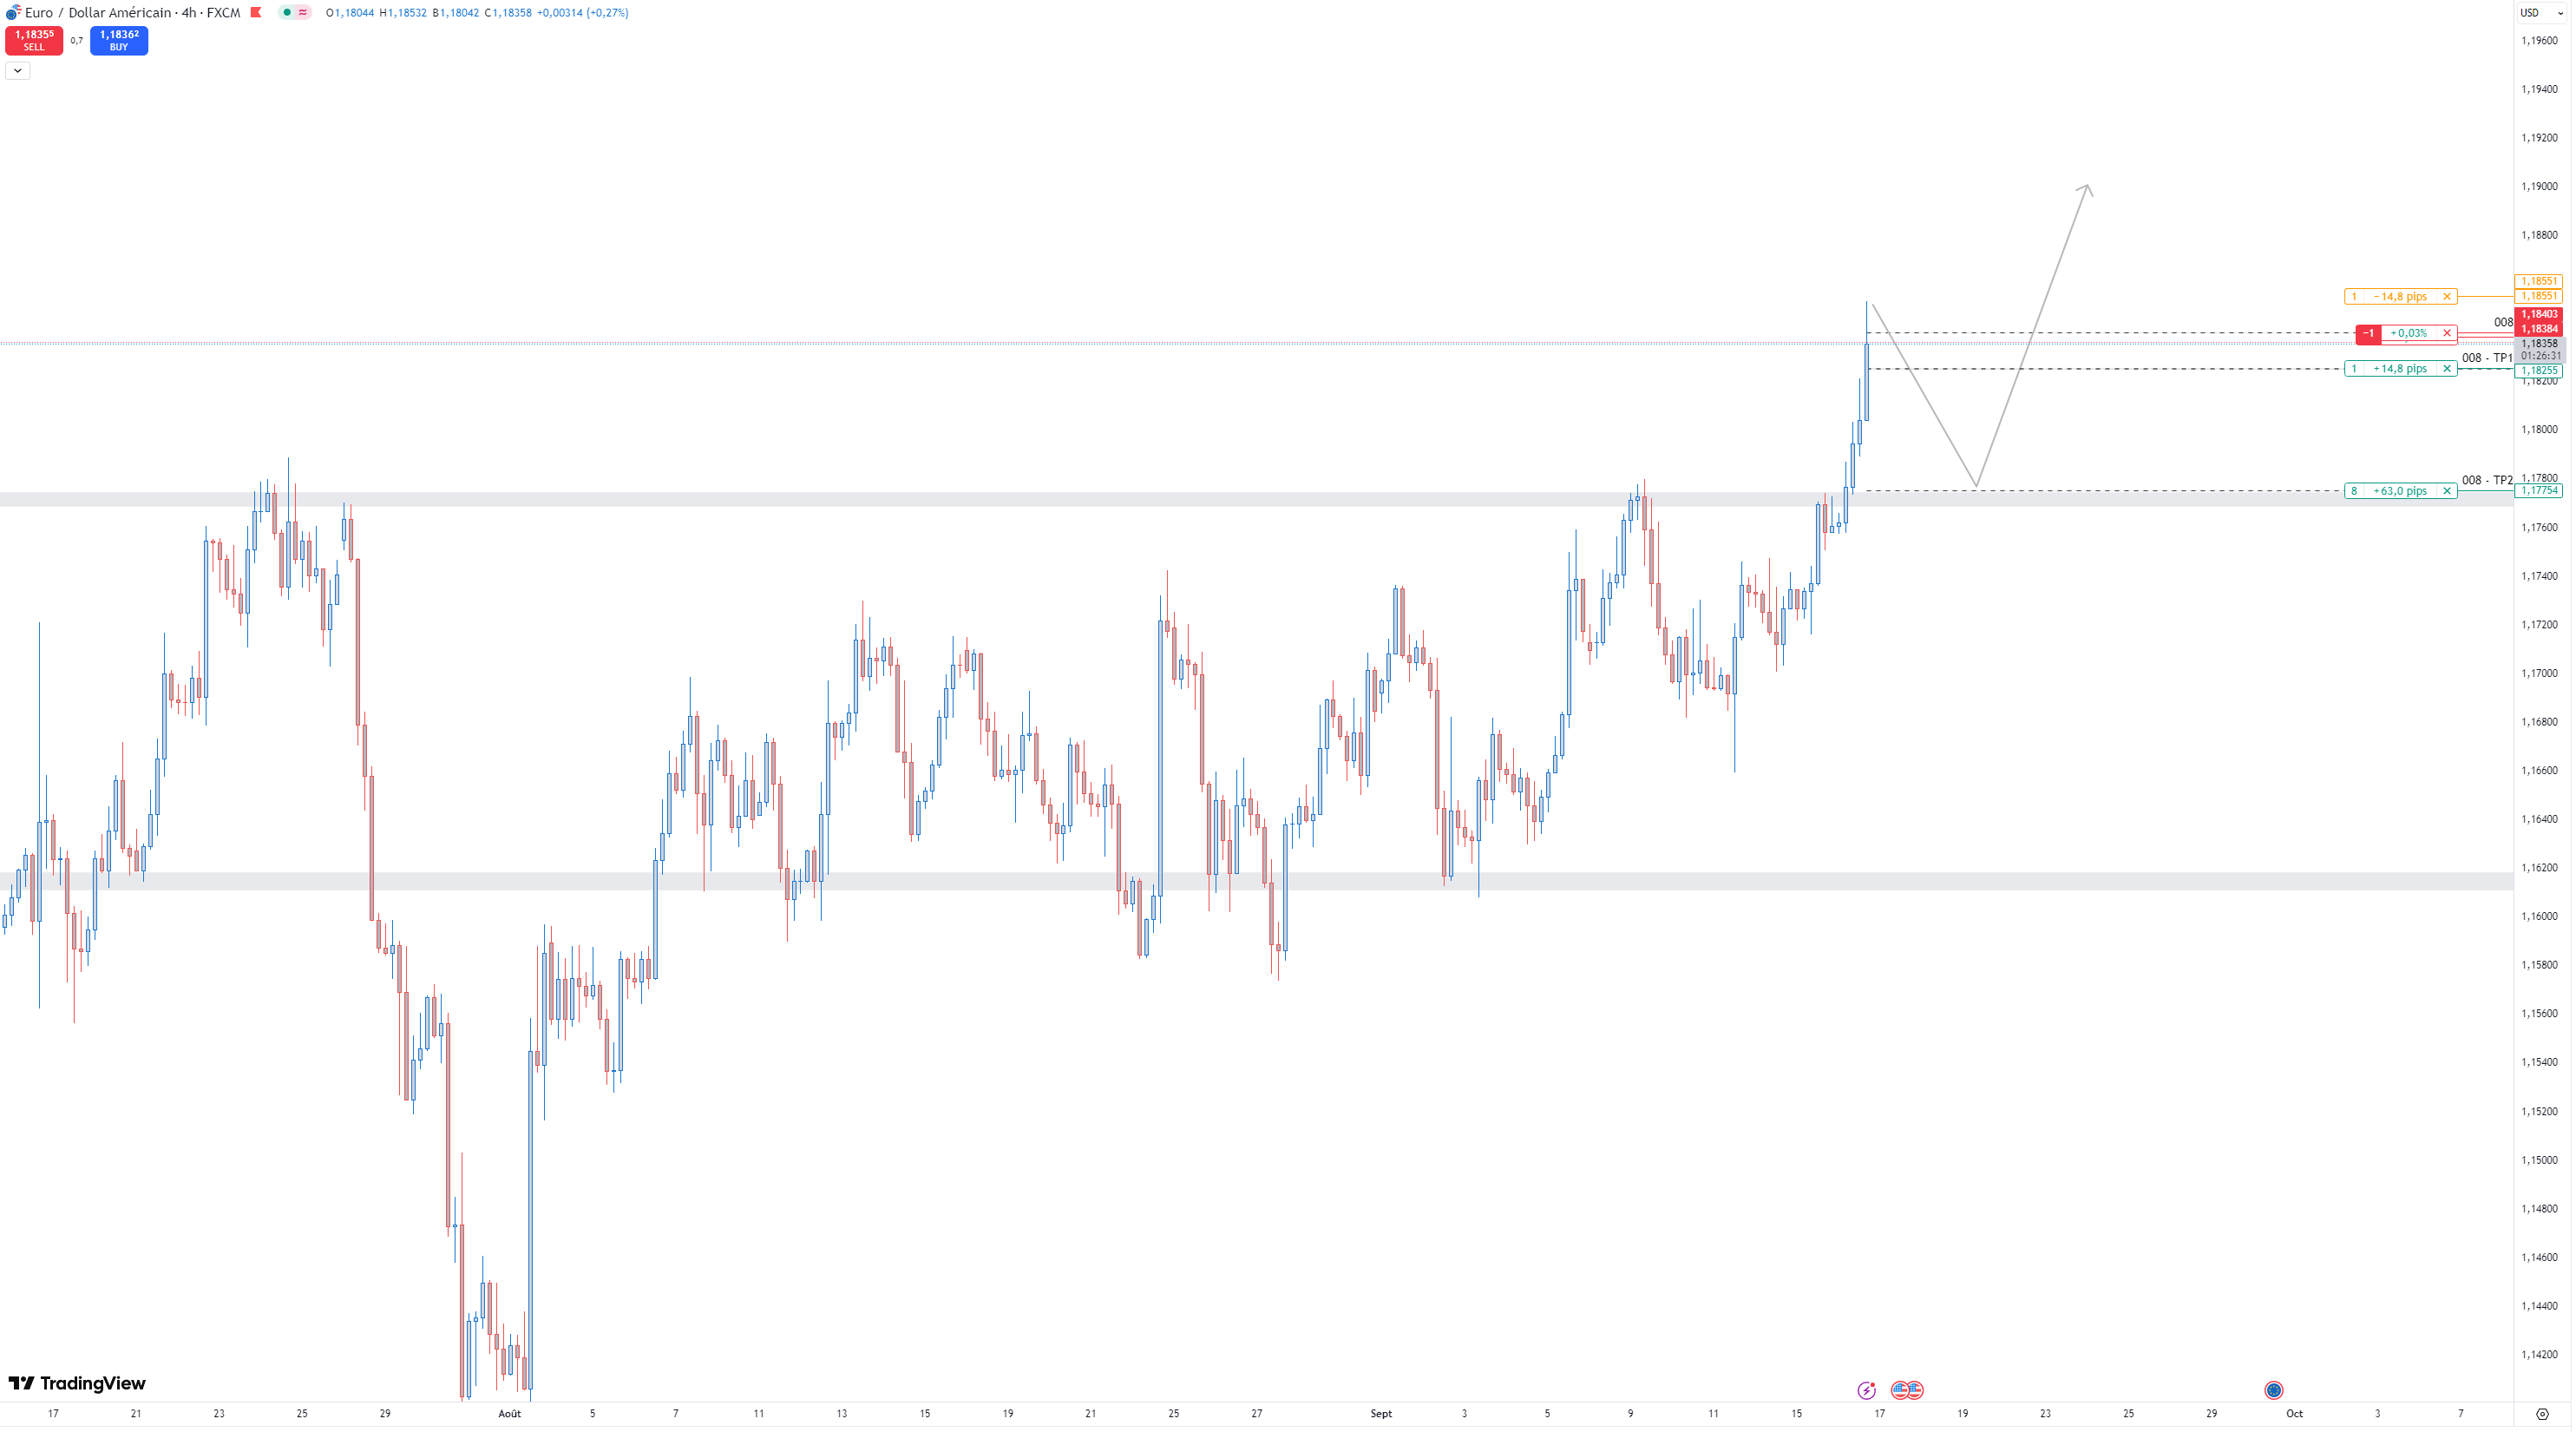
H4 : The H4 resistance has been broken last week and the pushback happened. Question, is it a real one, or is the market gonna go back in the range. In case of doubt I remember the long term picture and I stay long seeing the Monthly chart.


5 min : I was waiting the resistance to break. I always enter a position on pullback / throwback. I sticked to my plan wich is a good thing.

Long @ 1.17165
TP 1 : 1.17244
TP 2 : 1.17481
TP3 : 1.18743

:writing_hand: TP1 reached


Stop Loss to 0

:writing_hand: TP2 reached

:end: Stop 0 reached

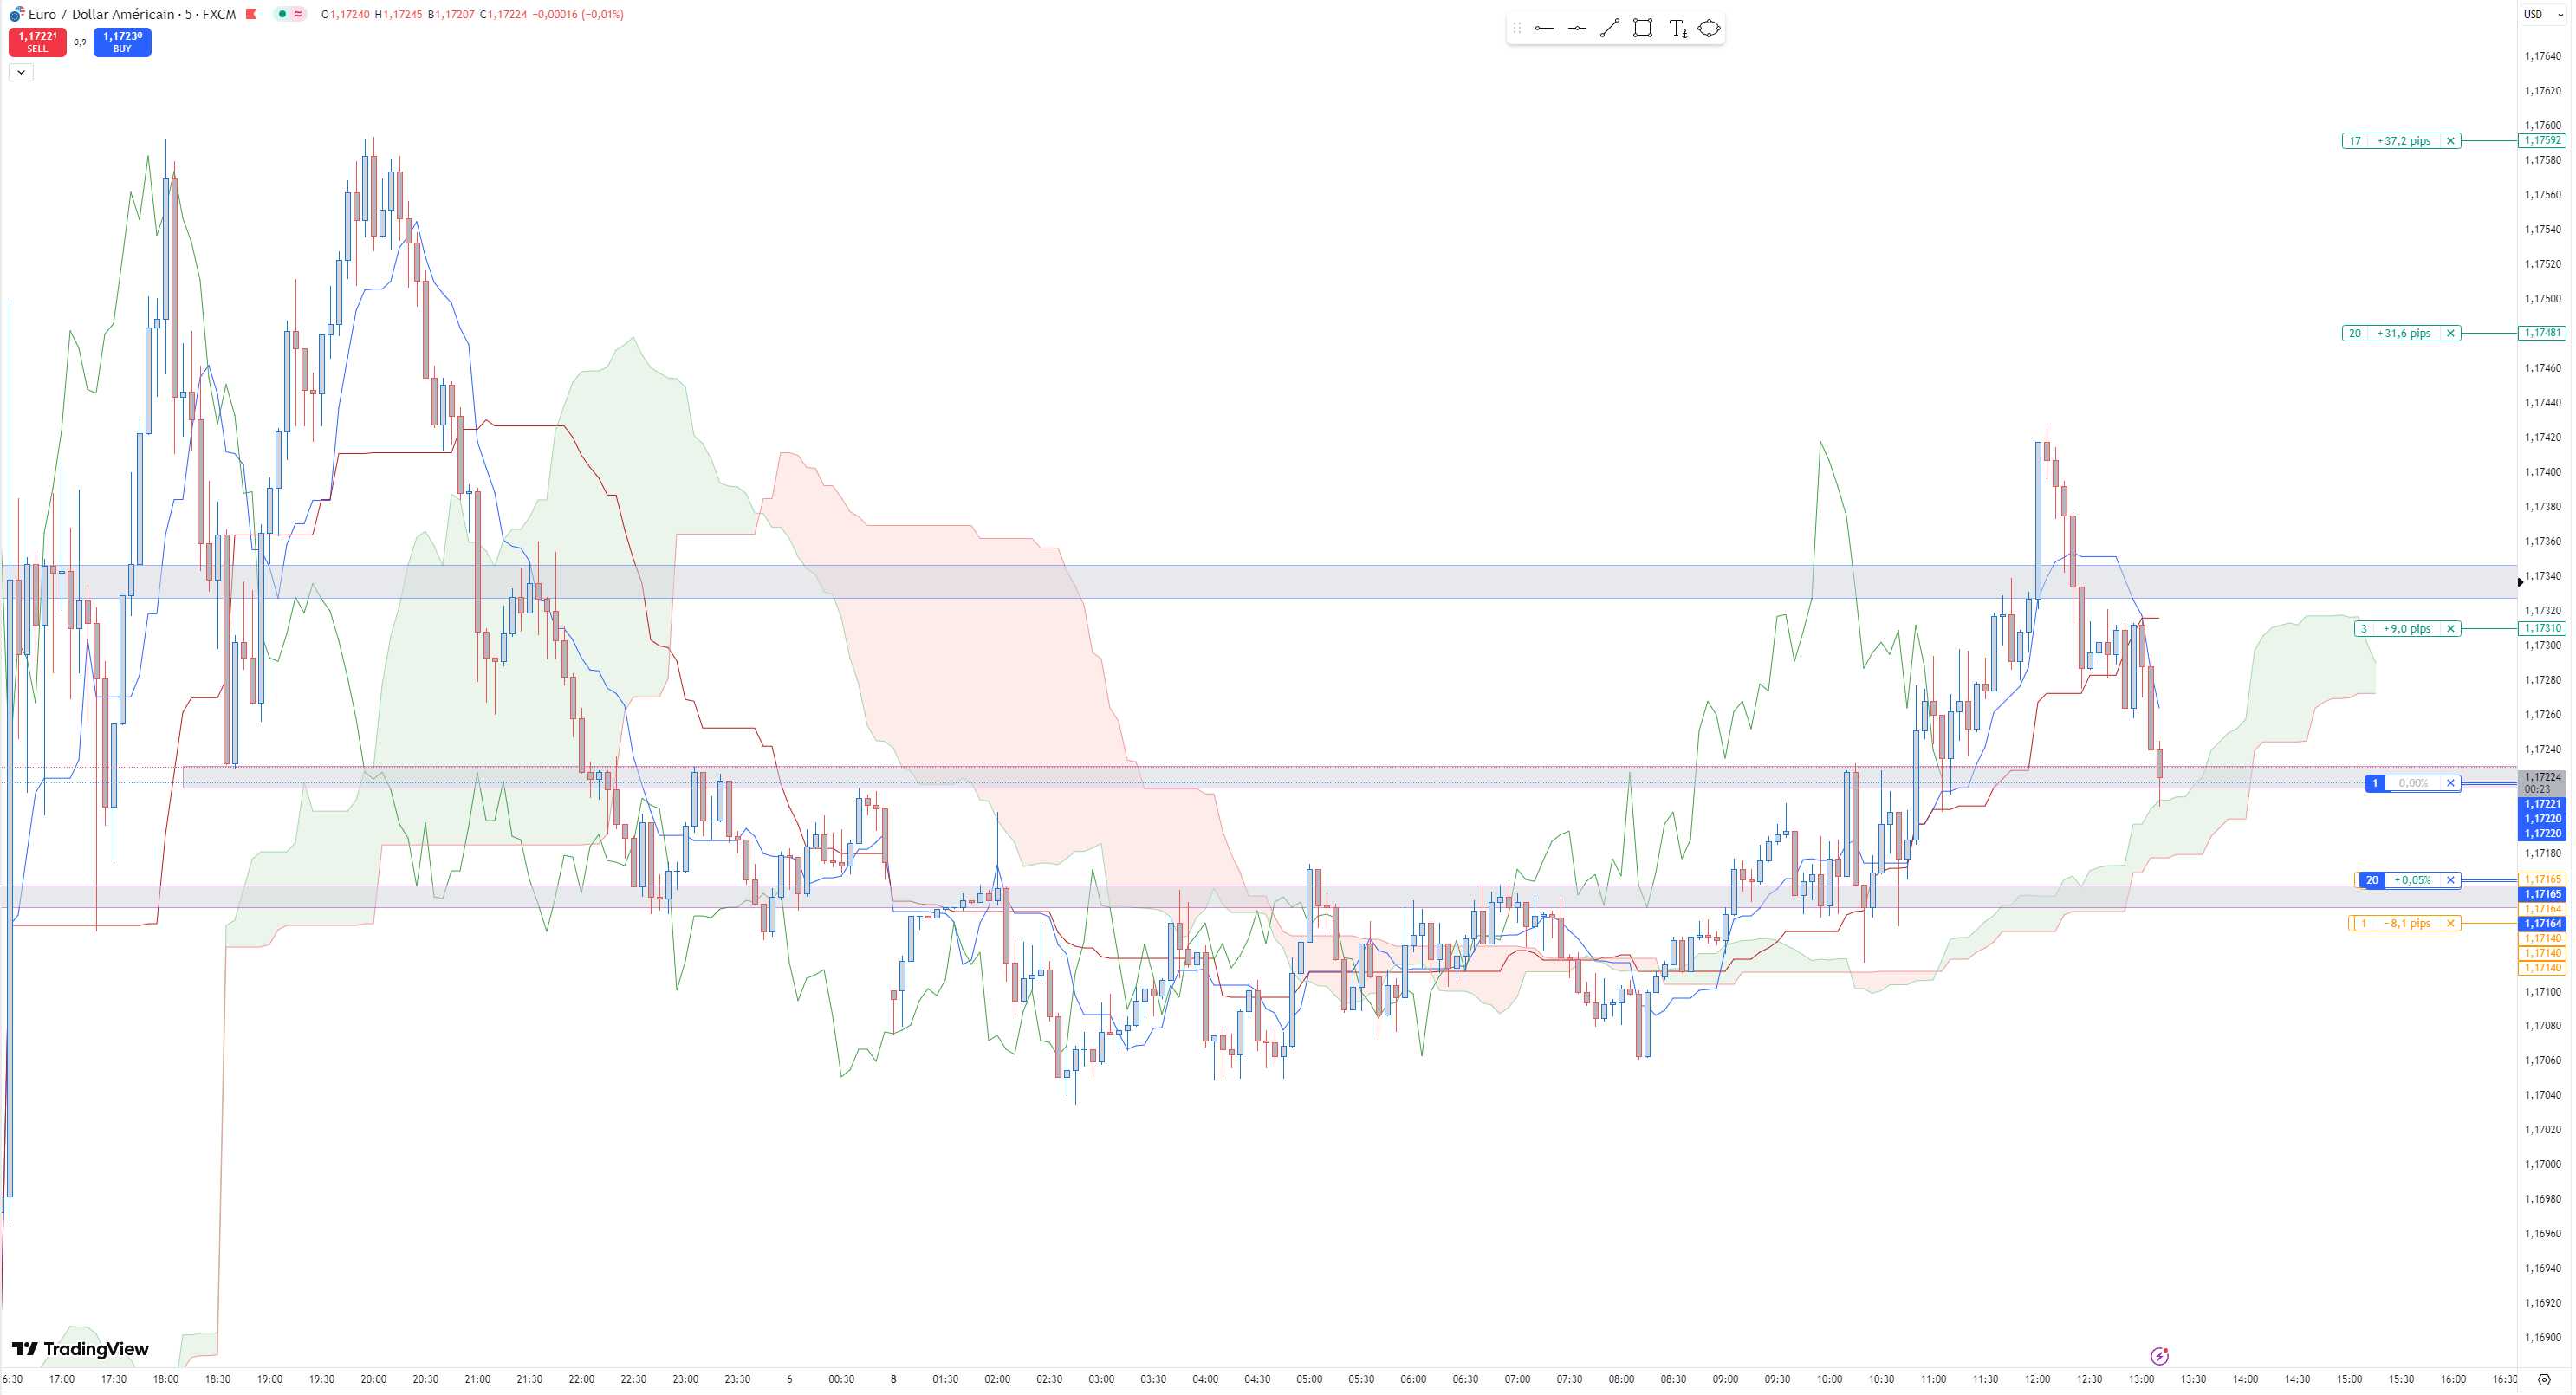
Hi ! I use Ichimoku to identify supports and resistance yes. But I mainly use it when I have doubts or when I don’t see any supports or resistances.

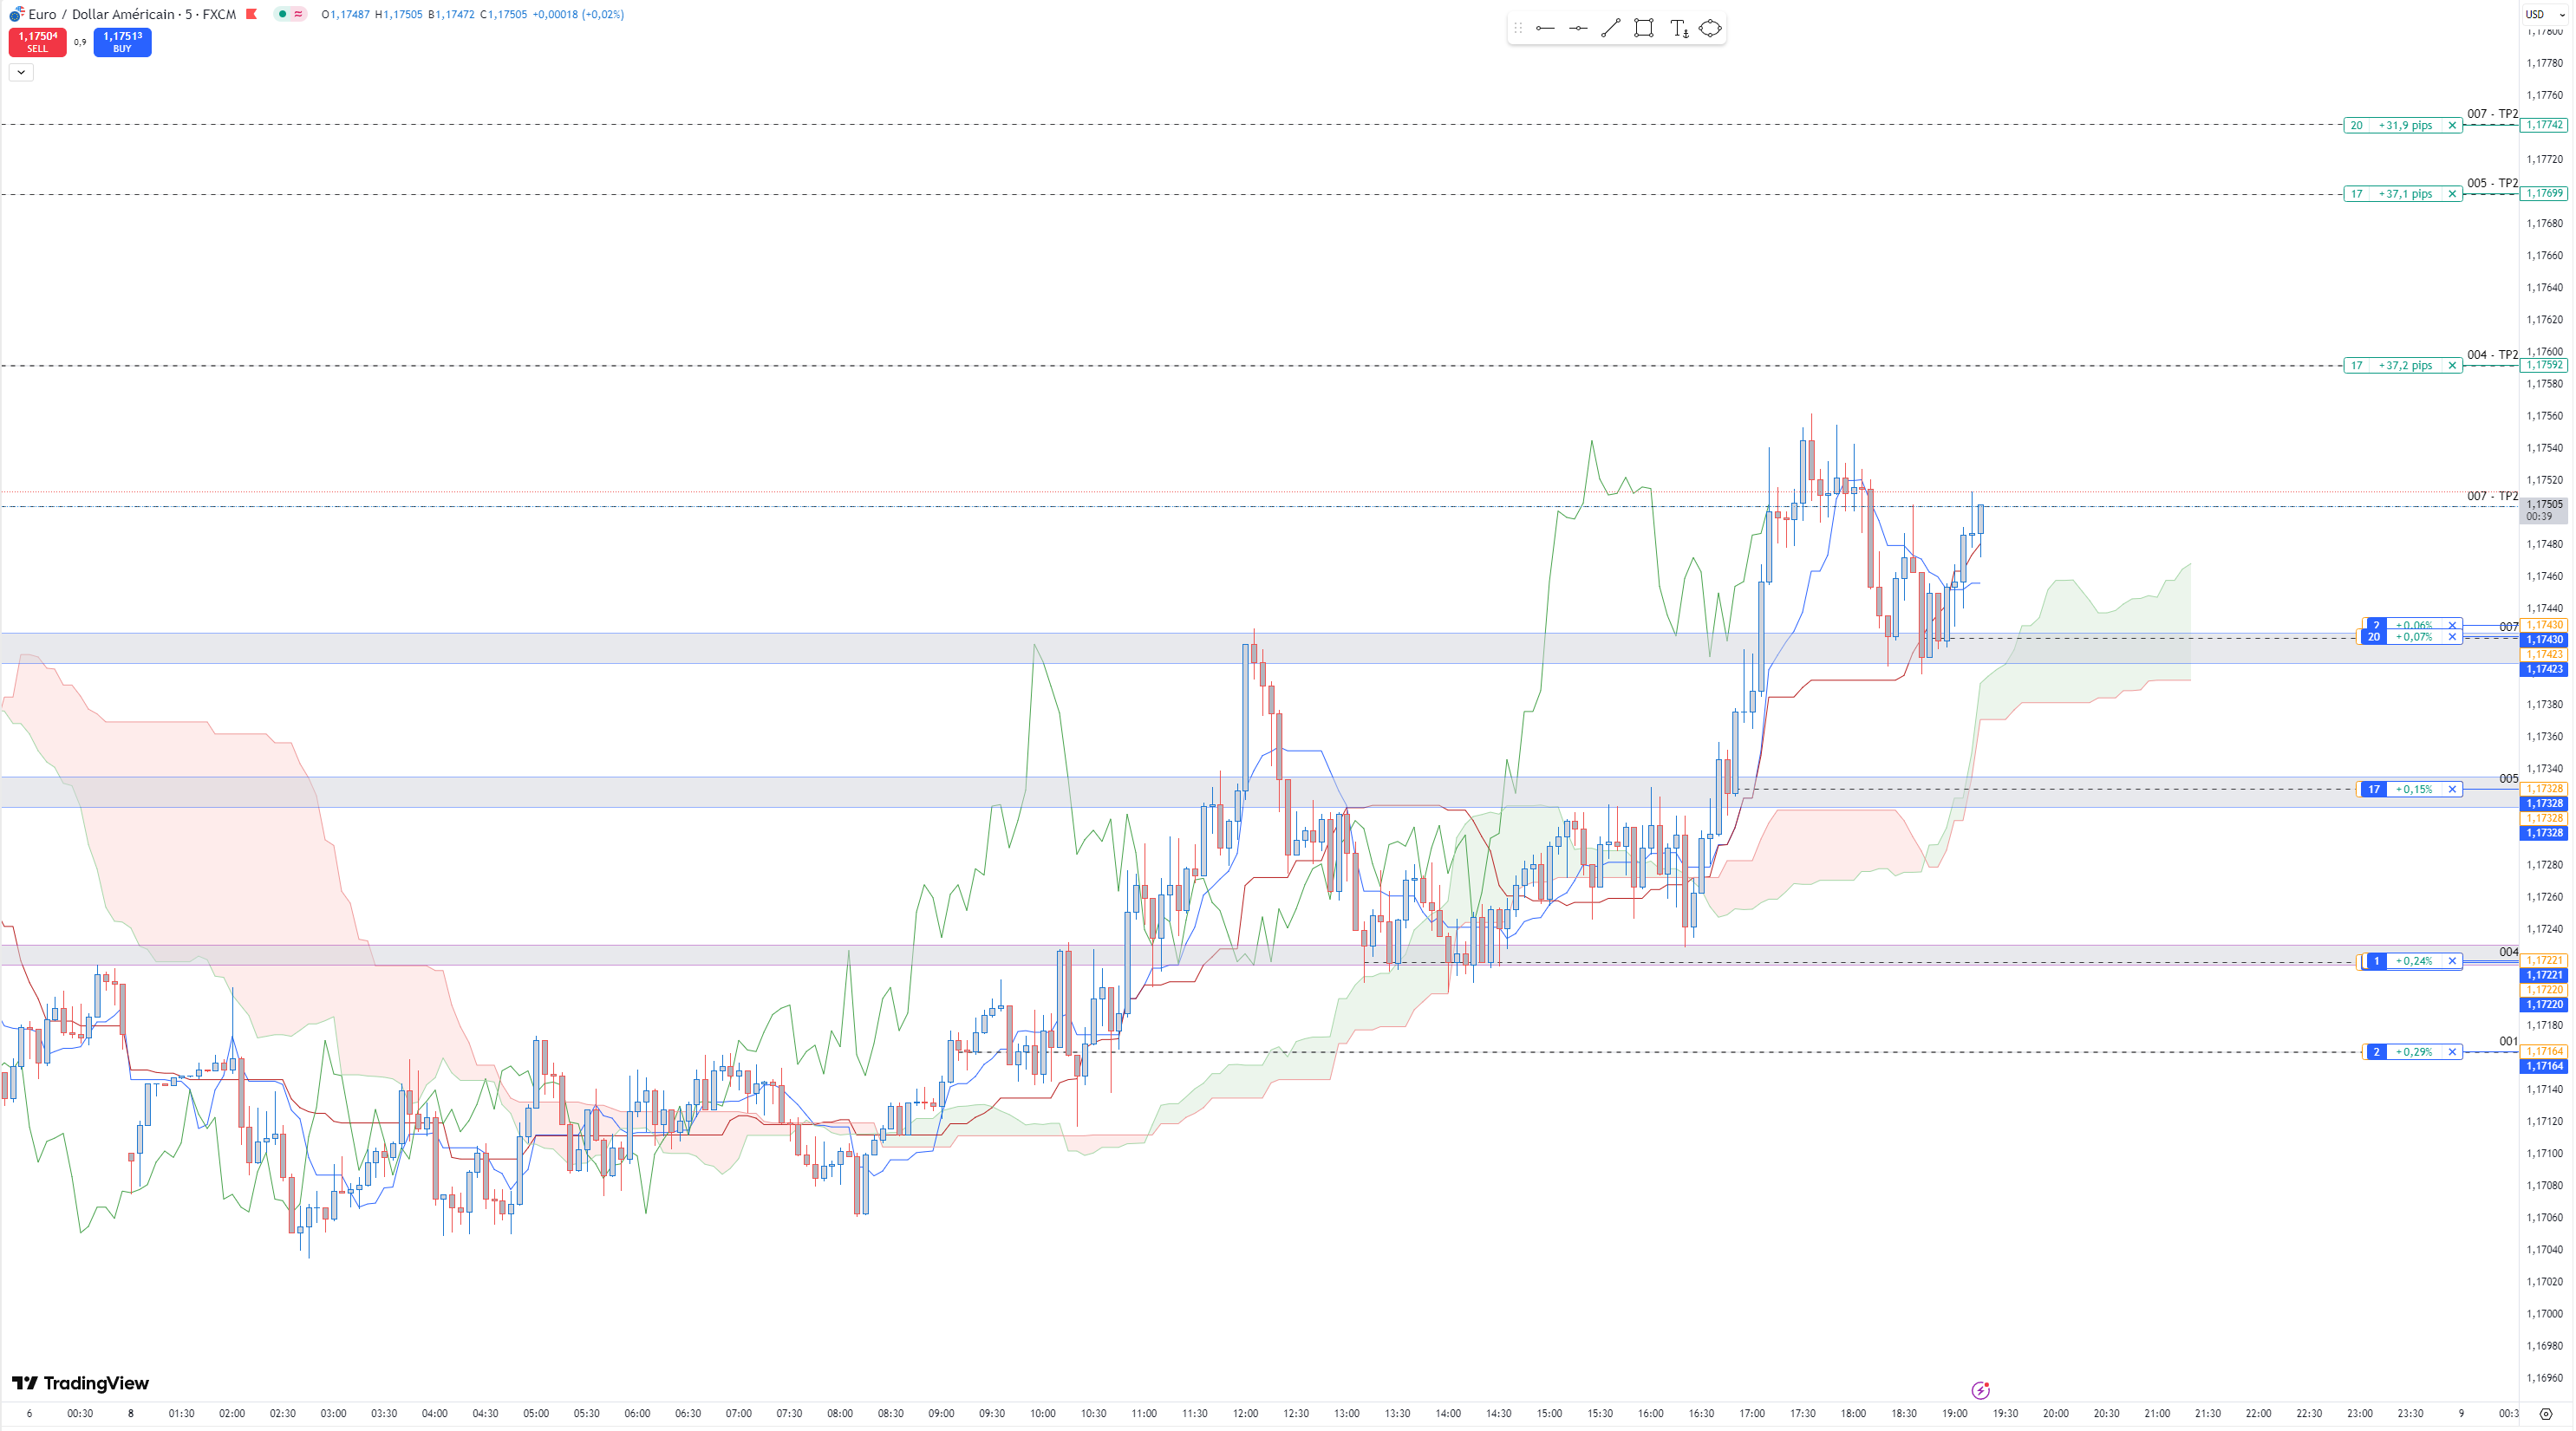
Also I focus on what happened recently, adjusting of course to the timeframe I’m doing my analysis. That’s whay on my recen Daily chart, you can see the spoort/resistance zone begin in the middle of the chart. :wink:

Trade 002 - Long EURUSD

Previous analysis on Monthly, Weekly, Daily, H4 stay the same.


5 min : Throwback on support.

Long @ 1.17230
TP 1 : 1.17293
TP 2 : 1.17545
TP 2 : 1.18811

[MAJ] Take Profit 1 reached. Stop Loss to 0

[END] Stop to 0 reached.

Trade 003 - Long EURUSD

Previous analysis on Monthly, Weekly, Daily, H4 stay the same.

5 min chart :

Long @ 1.17339
TP 1 : 1.17445
TP 2 : 1.17762
TP 2 : 1.18928

[END] 5 min chart : Stop loss reached.

Trade 004 - Long EURUSD

Previous analysis on Monthly, Weekly, Daily, H4 stay the same.

5 min chart.


Back on a support zone, corresponding to Ichimoku’s cloud.

Long @ 1.17220
TP1 : 1.17310
TP2 : 1.17591
TP3 : 1.20405

:writing_hand: [TP1]

:writing_hand: TP2 reached

:end: Stop 0 reached

Trade 005 :arrow_upper_right: EURUSD LONG

  • Monthly chart : no change
  • Weekly chart : no change
  • Daily chart : no change
  • H4 chart :

    This time we have confirmation that the prices broke the resistance. We had a pushback, and the trend is going upward.

:writing_hand: TP1 reached


Stop loss to 0

:writing_hand: TP2 reached

:end: Stop 0 reached

Trade 006 :arrow_upper_right: EURUSD LONG

  • Monthly chart : no change

  • Weekly chart : no change

  • Daily chart : no change

  • H4 chart : no change

  • 5 MIN chart :


    I’m keeping an eye on this support, with the Kijun as a target to enter long.

:writing_hand: 5 MIN chart : Order triggered

:writing_hand: TP 1 reached


Stop loss to 0

:end: Stop @ 0 reached.

Trade 007 :arrow_upper_right: EURUSD LONG

  • Monthly chart : no change
  • Weekly chart : no change
  • Daily chart : no change
  • H4 chart : no change
  • 5 MIN chart :

    Buy on support which also corresponds to the Kijun.

:writing_hand: TP1 reached


Stop loss @ 0

:writing_hand: TP2 reached

:end: Stop 0 reached

Monthly analysis

Weekly analysis

Daily analysis

H4 analysis

Trade 008 :arrow_lower_right: EURUSD

Chart H4 : my scenario is that the price could do throwback on the H4 support.

Chart 5 min : Bearish engulfing candlestick pattern.

:end: Stop Loss reached.

1 Like

Euro crazyass strong today…

1 Like

Trade 009 :arrow_lower_right: EURUSD

Chart 5 min

:writing_hand: TP1 reached - SL 0

:end: SL 0 reached

Trade 010 :arrow_lower_right: EURUSD
.
Chart 5min - Downtrend / Kijun


.
:end: Stop Loss reached.

:bulb:Note to self : My entry point was bad and I felt impatient. If I use Ichimoku, I have to combine it with the basics : supports/resistances.

Trade 011 :arrow_lower_right: EURUSD
.
Chart 5min - Pushback under resistance + Kijun and Tenkan on this level.

:end: Position closed manually before the FED

Trade 012 :arrow_upper_right: EURUSD
.
Chart 5min

:writing_hand: TP 1 reached


.
:end: SL 0 reached

Trade 013 :arrow_upper_right: EURUSD
.
Chart 5 min


.
:end: SL reached.

Trade 014 :arrow_upper_right: EURUSD
.
Chart 5 min


.
:writing_hand: TP 1 reached

.
:writing_hand: SL 0 reached