$SMH Elliott Wave and Longer Term Cycles
Firstly as seen on the monthly chart shown below. There is data back to May 2000 in the ETF fund. Data suggests the fund made a low in November 2008. This low has not been taken out in price. The cycles in this instrument tends to reflect the Nasdaq index fairly well however it has a larger degree difference in that the Nasdaq made a low to correct the cycle from the all time lows in October 2002 compared to the all time low made in November 2008 in the SMH semiconductors.
Secondly the highlighted area on the monthly chart is the Fibonacci extension of the 1-2 move up from the December 2018 lows. Every way I count this data it suggests several things. One view is a rally could be done or at least near that. If so then a turn lower should be already happening to correct the cycle up from the 2008 low. The data does not support that as of now. The other count shown is too conservative. The reason being that the wave (III) in blue is still in progress toward the 162.28 extension on up to the 185.00 area before it corrects the cycle up from the 2010 lows. That 185.00 round figure comes from a Fibonacci extension of 161.8 measured from a hypothetical zero starting point up to the June 2000 highs down to the November 2008 lows.
The analysis continues below the monthly chart.
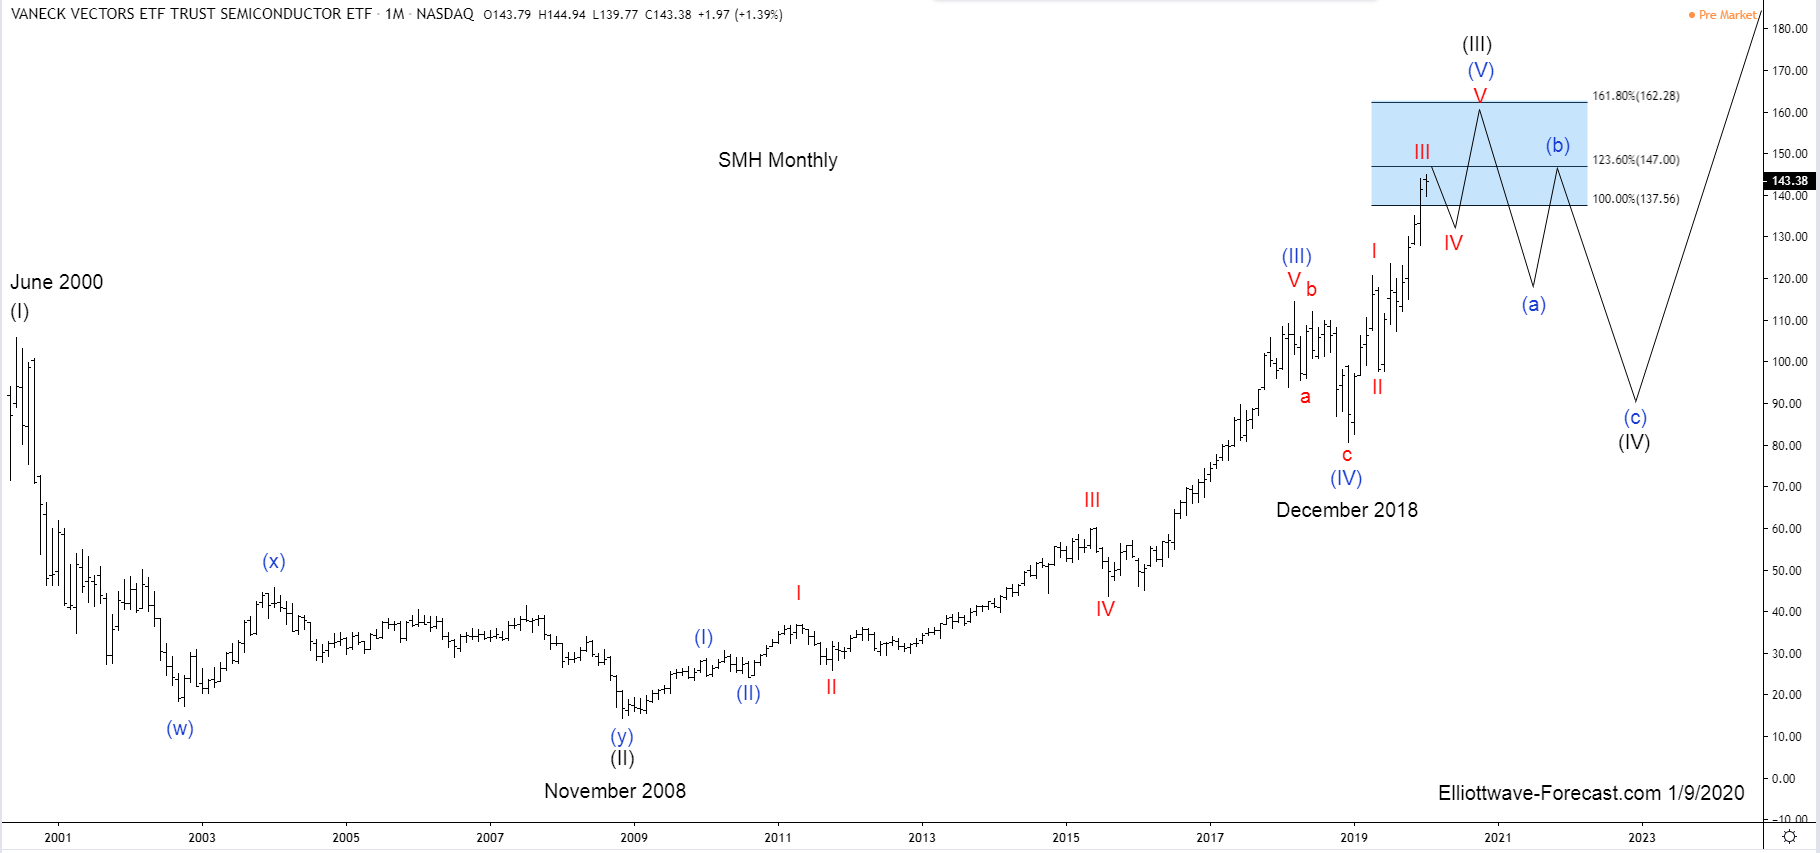
Thirdly and in conclusion. The instrument could already be called lower correcting the cycle from the 2008 lows. The other extreme in the bullish direction is higher toward 185.00. That is before it corrects the cycle up from the blue wave (II) lows. The chart I have posted takes the compromise in between of the two views. I always like to give the trend benefit of the doubt. In this case it should be obvious the trend is higher. Nearest term in the time frames not highlighted on the chart above the SMH should trade higher while above the December 2019 lows and certainly while above the December 2018 lows according to the price data currently available.