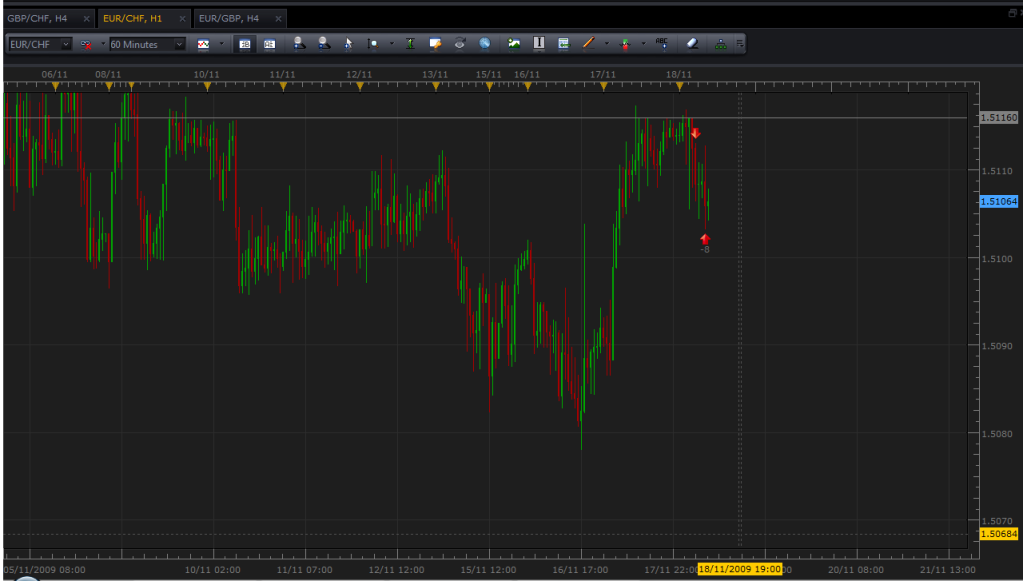
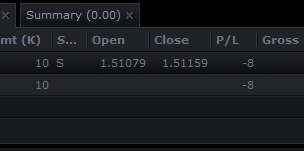
I was trading this position on FXCM demo marketscope software. If you look at my screenshot, the first arrow (pointing down) points to the candle where i entered my trade and the second candle (pointing up) where the trade was closed. I placed my stoploss on the 1.51160 level, you can see it that i drawn the line at the resistance level (grey line). I went off and came back shocked to see my stop loss hit, when you can see very clearly that the last candle where the stoploss was supposedly hit still a long way away from my stoploss! What is happening???:eek:
There’s an easy way to check. At the top of the chart, there’s a button with a B and a button with an A. B stands for Bid (sell price). A stands for Ask (buy price). If you’re short a currency, the order to close the trade is going to be a buy order. Therefore the buy price will trigger a stop or limit. See the chart below, I changed it to an Ask chart and clicked on the candle to show the high price. The high was 1.51161.