The next entry in the theme of Corona Virus stocks is Sona Nanotech. Normally I would cover a major listed stock on a USA exchange. However, Sona Nanotech has an excellent Elliott Wave structure that is worth reviewing. SONA has exploded since early 2020 from a little known company to one partnered with the likes of GE Healthcare. Like all charts, It also remains very technical.
Sona Nanotech “produces high-quality gold nanorod products for diagnostic tests & medical treatment applications”. Their claim to fame in the current market environment is developing a lateral flow test for COVID that is cheap and can be used at home.
Let’s take a look at the charts (all prices are in $CAD)
Sona Nanotech Elliott Wave View
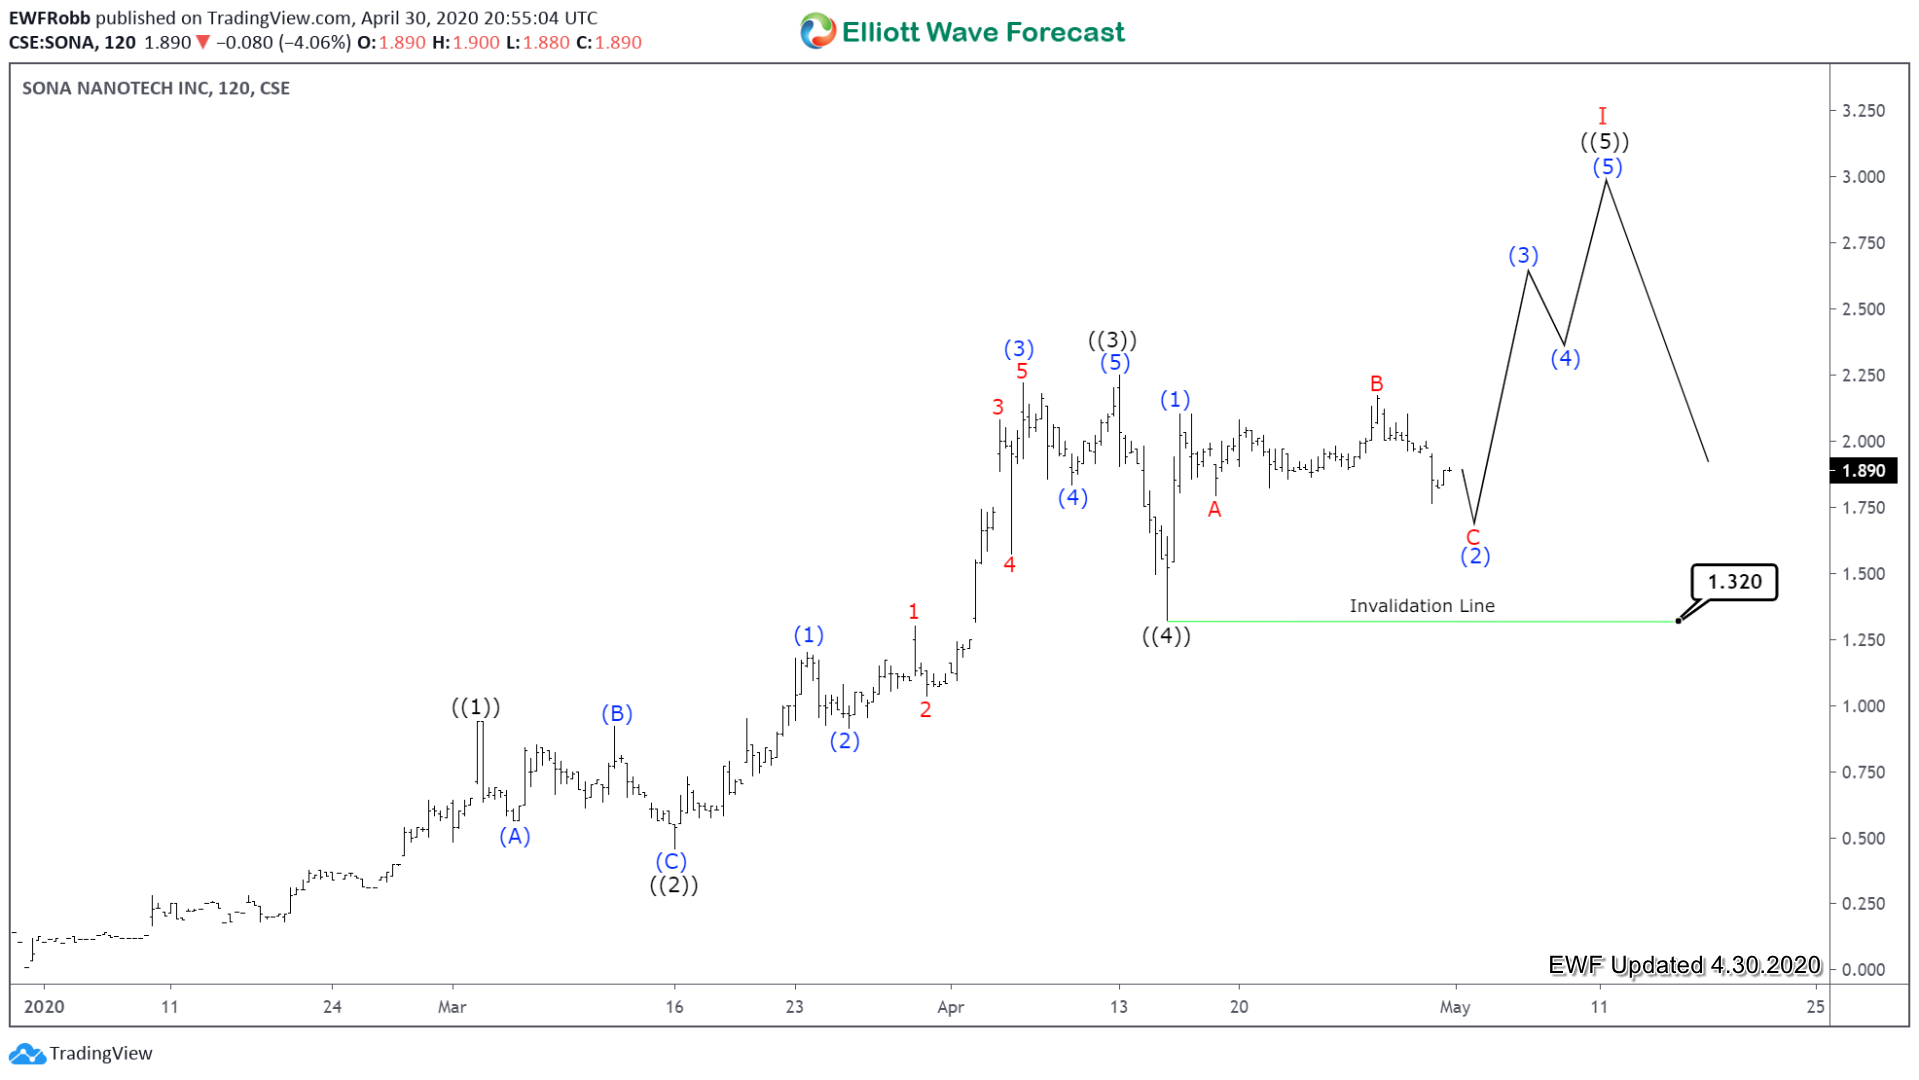
Sona Nanotech set all time lows in late December 2019 at $0.01. From there a wave ((1)) top was set at $0.94 on March 3/2020. From there wave ((2)) is set at $0.455 on Mar 16/2020 and a wave ((3)) advance is proposed topped at $2.25 on April 13/2020. The current idea is a flat for Blue (2) presently underway before heading higher into a black ((5)) of Red I top. Invalidation level is 1.32, if this pivot gives then the odds increase that a long term top has been set. With that said, it does have room for one more leg up to complete the sequence from the all time lows. If it does decide to head up for one more high, it could be a long term top.