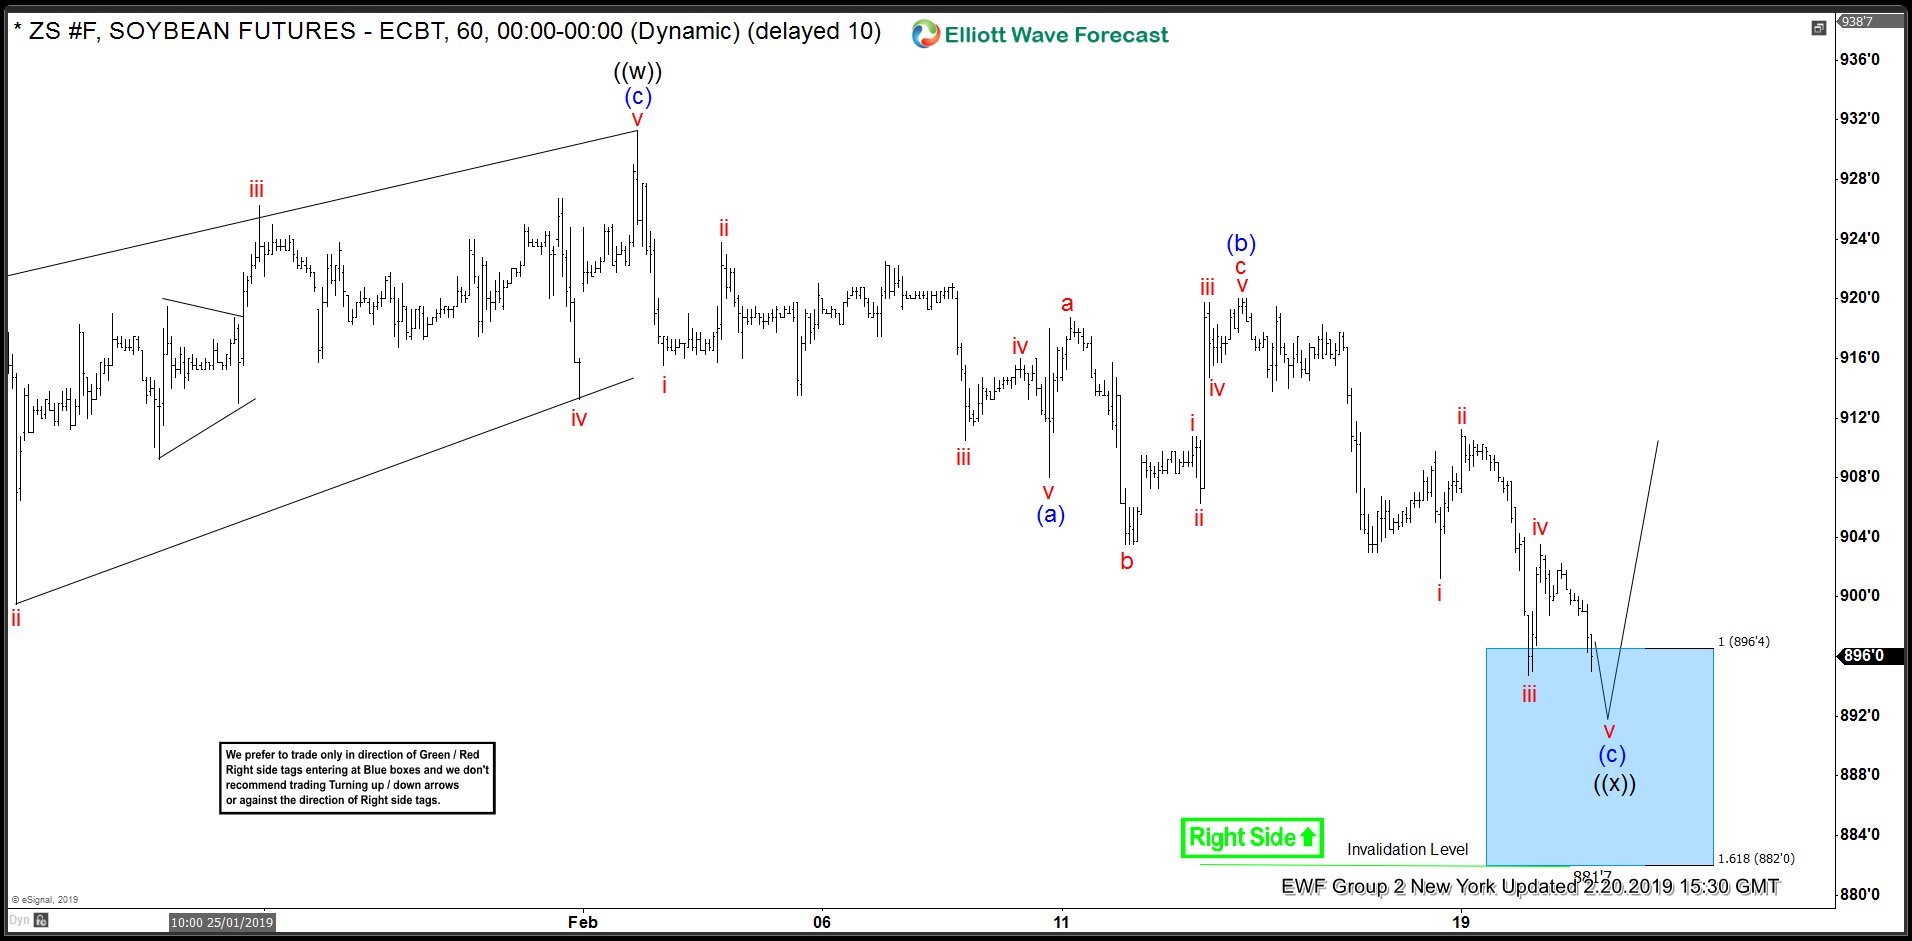
Hello fellow traders. Today, I want to share some Elliott Wave charts of Soybean (ZS_F) which we presented to our members in the past. Below, you see the 1-hour updated chart presented to our clients on the 02/20/19. showing that ZS has a 1 Hour right side tag against 882 low.
From 12/27/18 low (867.2) ZS ended that cycle at 01/02/19 peak (920.16) in black wave ((w)). Below from there, we advised members that it should see the equal legs from that peak towards the areas of the 100 - 1.618 Fibonacci extension of blue wave (a)-(b) which came around 896.4-882.0 and unfolded as an Elliott Wave Zig Zag structure. Therefore, we expected buyers to appear in the sequences of 3, 7 or 11 swings. Due to the right side tag which you can see in the chart below, we issued a long position at the blue box area. As that was the first area for buyers to appear to take prices to new high above 02/02/19 (920.16) peak. Or a larger 3 waves reaction at least.
Soybean (ZS_F) 1 Hour Chart Elliott Wave Analysis 02/20/2019
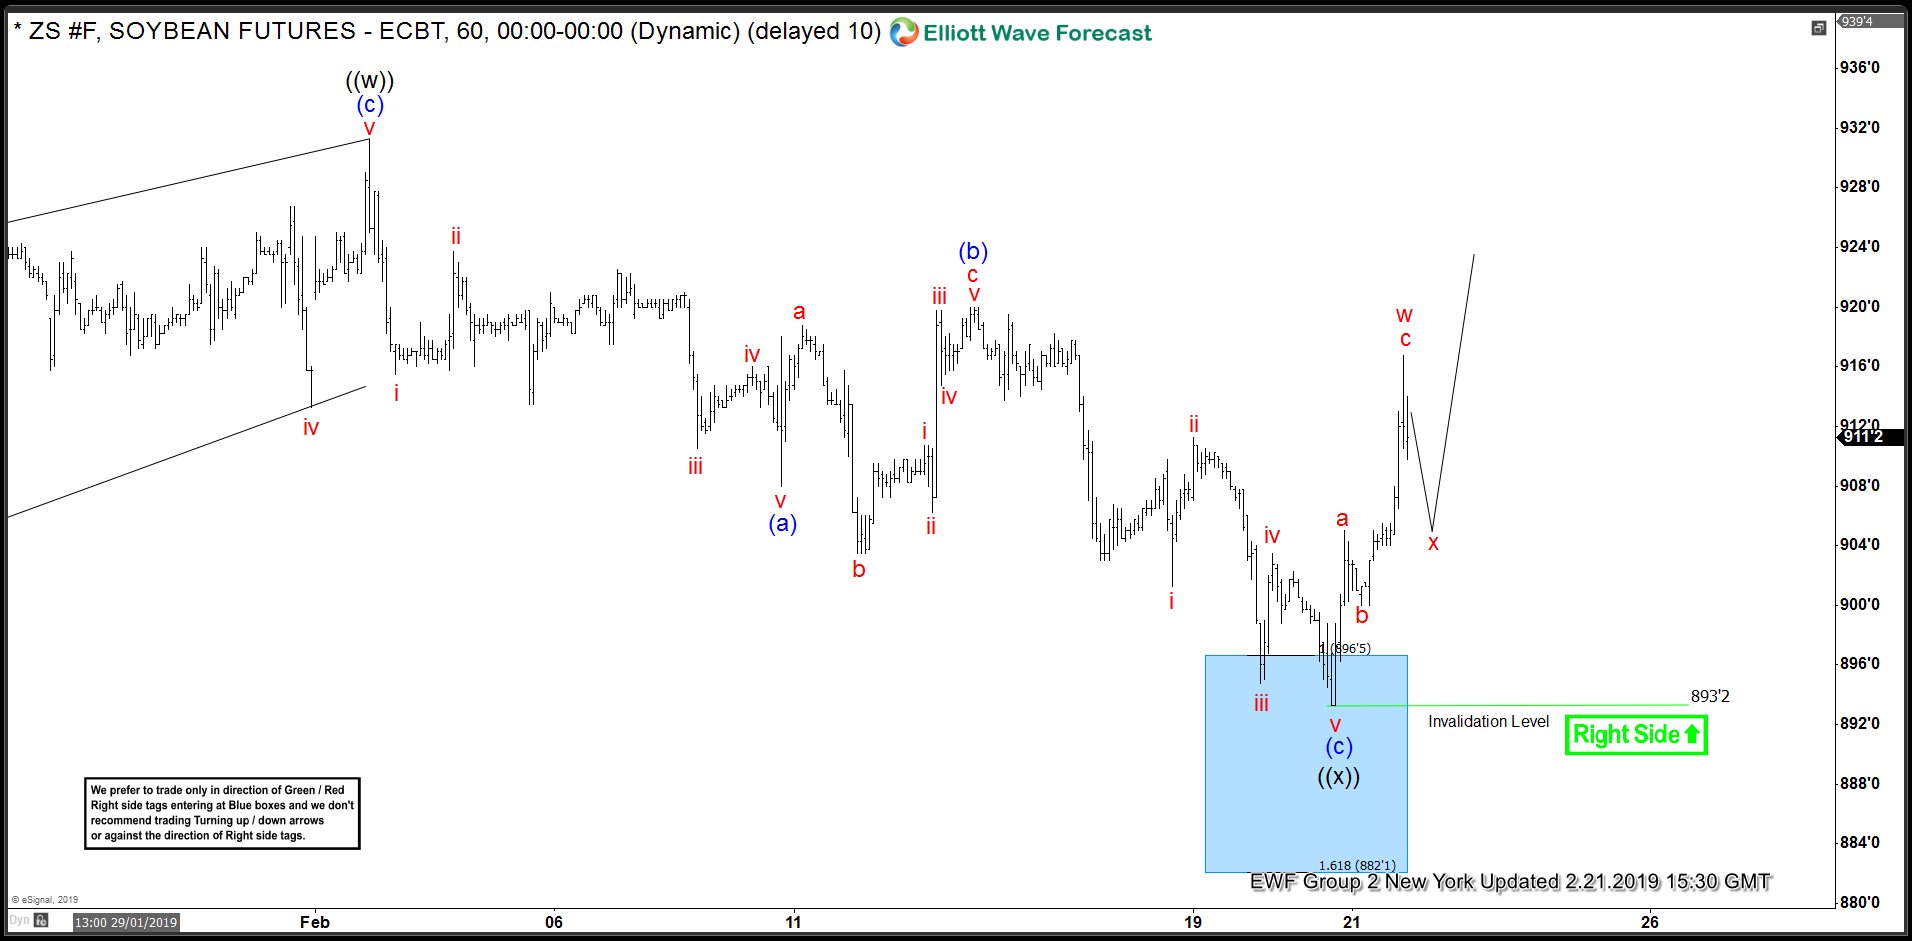
In the last Elliott Wave chart, you can see that ZS reached the blue box area and extend a bit into the blue box buying area. Then it showed a nice reaction higher. Due to the right side tag. We advised members to buy the blue box like said above. And if traded our blue box. Any trades from that area have been risk-free, which means the stop-loss was moved to break-even, targeting higher levels. Do please keep in mind that the 1-hour chart which I presented have changed already. The blue boxes you see in our charts are our so-called High-Frequency boxes. Where the market ideally shows us a reaction either lower or higher to allow us to move our stop loss quickly to break-even.
Soybean 1 Hour Chart Elliott Wave Analysis 02/21/2019
I hope you enjoyed this blog. I wish you all good trades and if you interested in learning more about our unique blue box areas and also want to trade profitably.