The fundamental outlook for Soybean (ZS) and other agricultural commodities continue to look bright. The major cost component of agricultural commodities is the energy prices. Farmers require gasoline to operate their equipment, while natural gas is used for fertilizer. The recent rise in energy price should continue to drive commodity prices up. Crude oil price increased by 150% since November 2020 last year, while natural gas rallied 139% since December 2020.
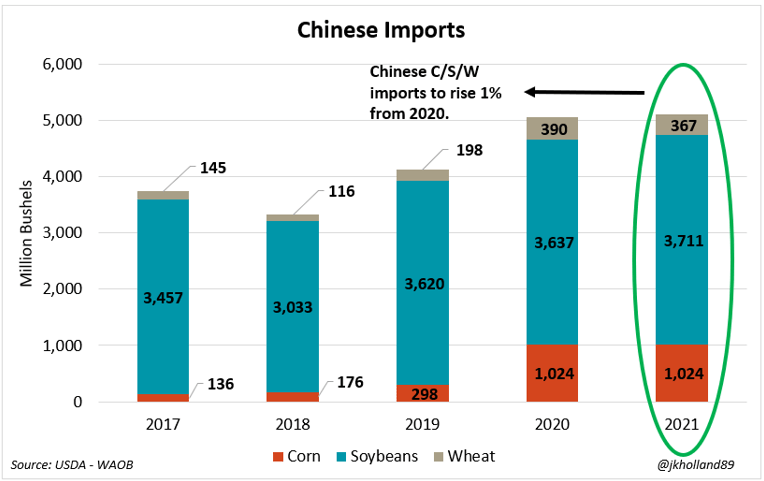
In addition, global supplies of soybean remain tight while Chinese import continues to rise. Below is the USDA estimate on Chinese import this year. Despite the ongoing trade war, the estimate calls for a record number of import.
Chinese Soybean Import
Soybean (ZS) Weekly Chart
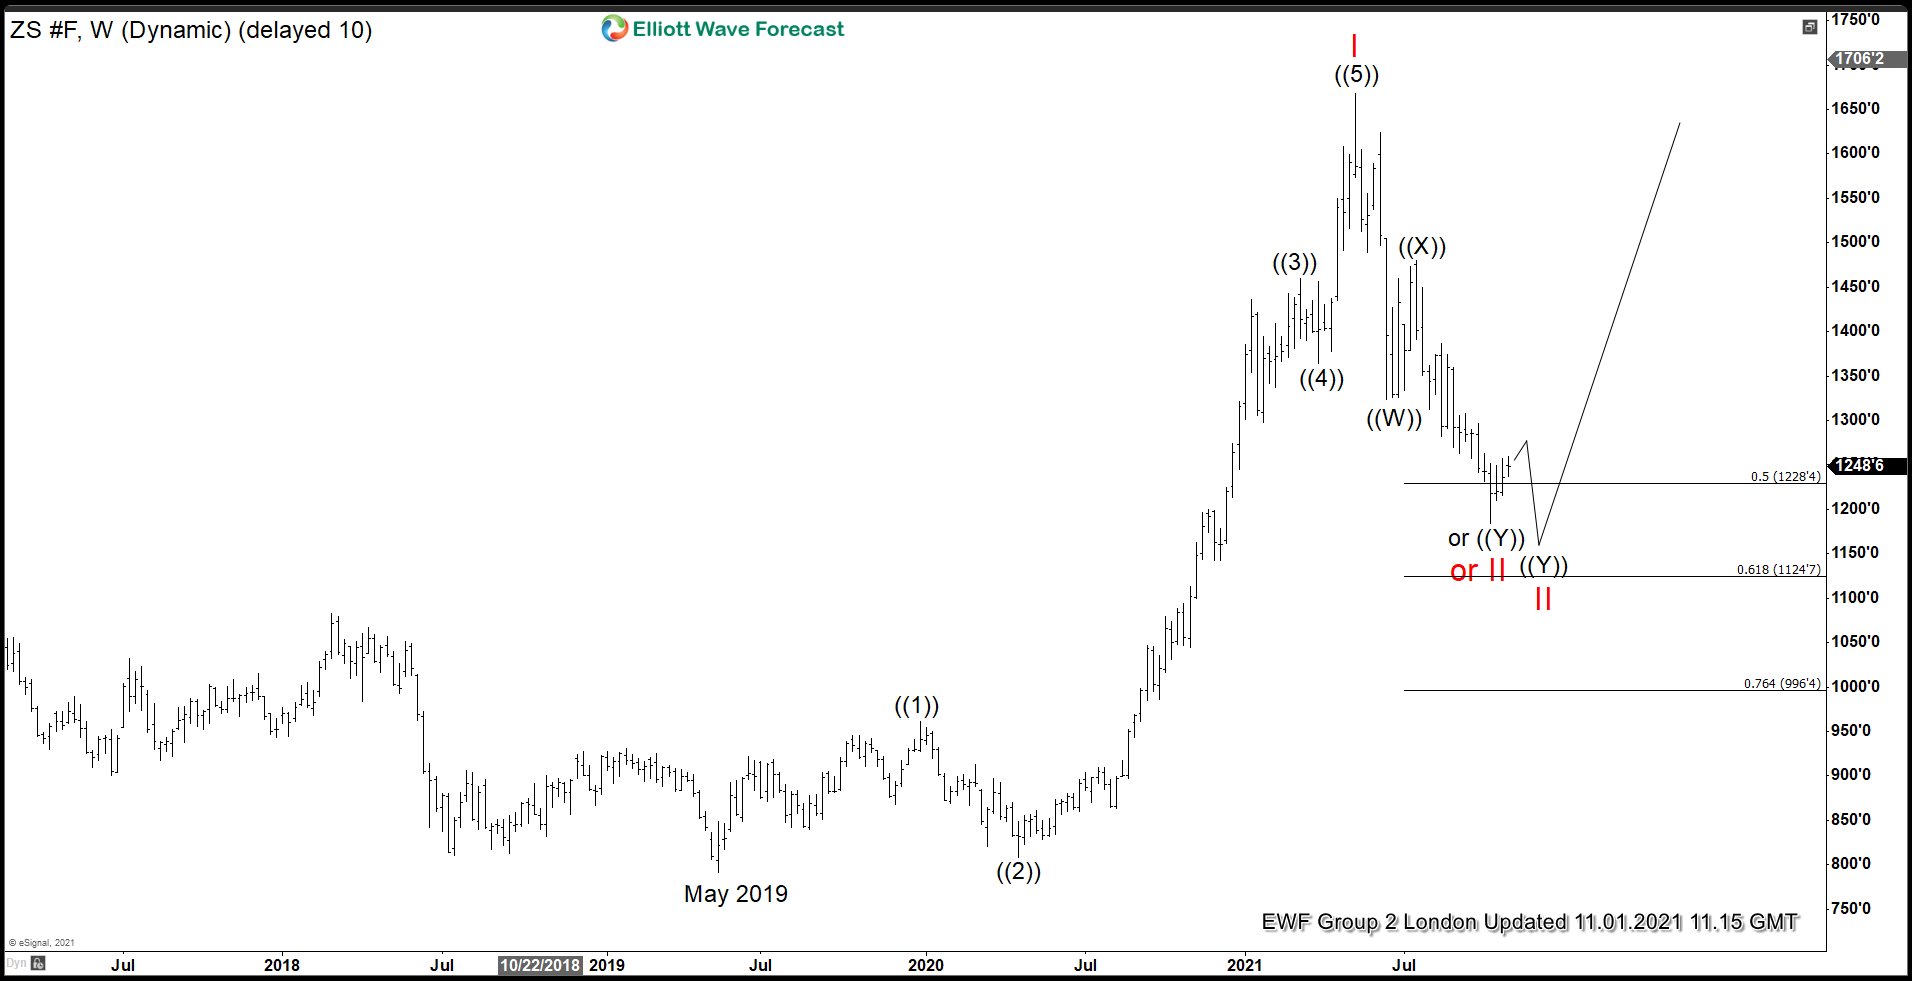
ZS weekly chart shows an impulsive rally from May 2019 low suggesting the higher time frame trend is looking higher. Up from there, wave ((1)) ended at 961 and pullback in wave ((2)) ended at 808.2. Soybean then extends the rally higher in wave ((3)) towards 1460 and pullback in wave ((4)) ended at 1364.2. Final leg higher wave ((5)) ended at 1667.4 and this completed wave I in higher degree. Wave II pullback is now either complete or can see 1 more push lower before the rally resumes. The commodity has reached 50% - 61.8% retracement area of the entire wave I rally from May 2019. This area typically is the support where we could see buyers for the next leg higher.
Source: Soybean Has Reached Support Area
 To be honest, I discover so much on this forums. I did not know you can even trade soybean.