Which commodity ?
Which Local Currency ?
Mate, you know what… i don’t trade Soyabean
but this is a perfect example to answer both your questions
let me show you how I FIGURED THIS OUT when i was a newbie 7 years ago approx.
and this works for any instrument.
-
Open the Chart of whatever you want. DO THIS ONLY ON DEMO
-
put down a trade 1.0 Lot to BUY
-
now put your TAKE PROFIT down and a Stop loss
now you said the price was 9.600 right
well, put a TAKE PROFIT AT 9.601
And put a STOP LOSS at 9.599
then see how much money you win or lose, whichever way it goes
-
if that doesn’t work, try this
Entry = 9.600
Take profit 9.610
Stop loss 9.590
and if that doesn’t help
Entry = 9.600
Take profit 9.700
Stop Loss 9.500
see what i’m doing
TEST IT
then ensure that it moved EXACTLY 1 place of whichever place value you were looking at
and DIVIDED IT UP BY THE AMOUNT THAT YOU WON
this will tell you definitely how much money you will move for how many pips
now try to use this as a guide
1.0 Lot = $10 per pip
0.1 Lots = $1 per pip
0.01 Lots = 10 cents per pip
so here is an example
EUR USD vs US2000 (Russell US200 Index)
if i put down a trade of 1.0 Lot on EUR USD it’s worth $10 per pip
if i put down 1 lot on US2000 it’s worth $1 per pip
you can find all this in the Contract Specifications as well
but testing is the best way to go
now beyond that, you can google it as well and see and compare your results
AND NO OFFENSE… some common sense would not go astray either
and if you have it, it will serve you well in trading
LET ME EXPLAIN THIS LIKE THIS…
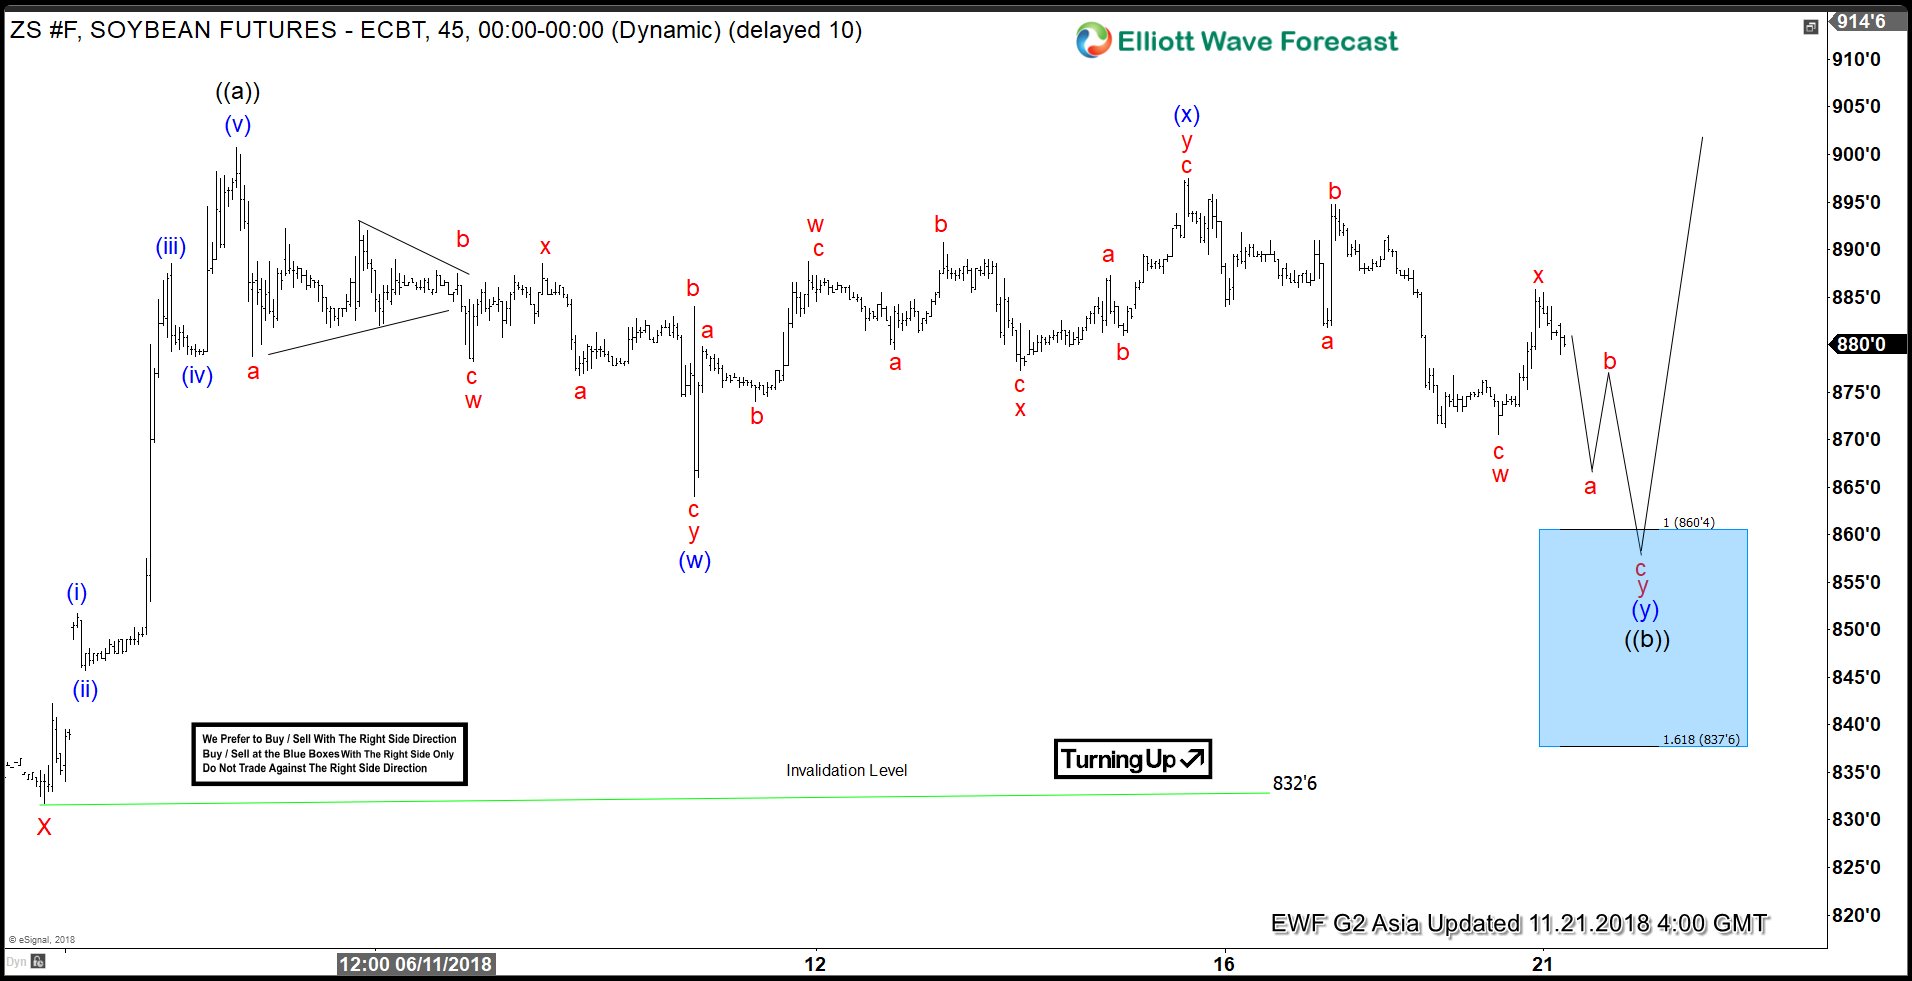
i googled “SOYBNUSD FORECAST”
one of the results was from TradingView… ok
i’m not interested in price accuracy… just price
so we have this… on this site…

not the writing at the bottom and the prices

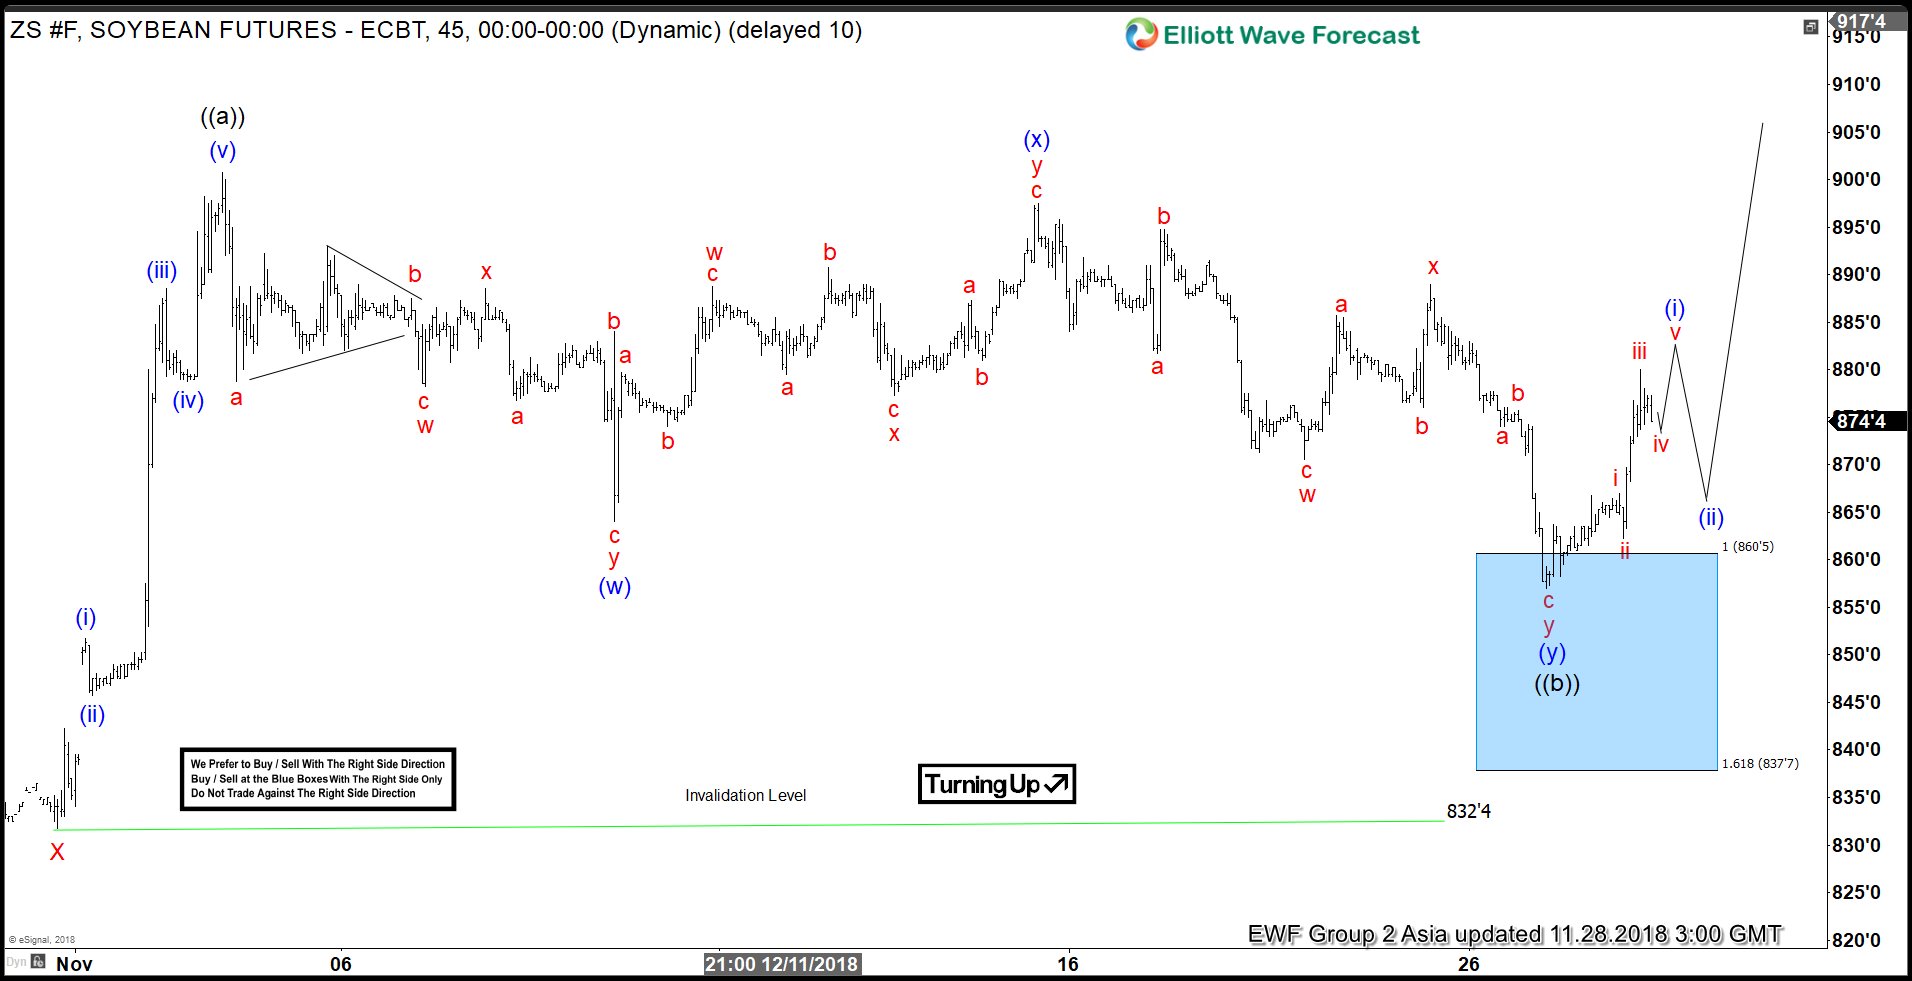
ok so
9.620
9.644
9.546
and let’s compare this to your
9.600
9.800
so so far we can conclude the following
THE NUMBER OF DECIMAL PLACES IS CORRECT AS BEING 3 PLACES
but we still don’t know which one is the point and which is the pip
ok
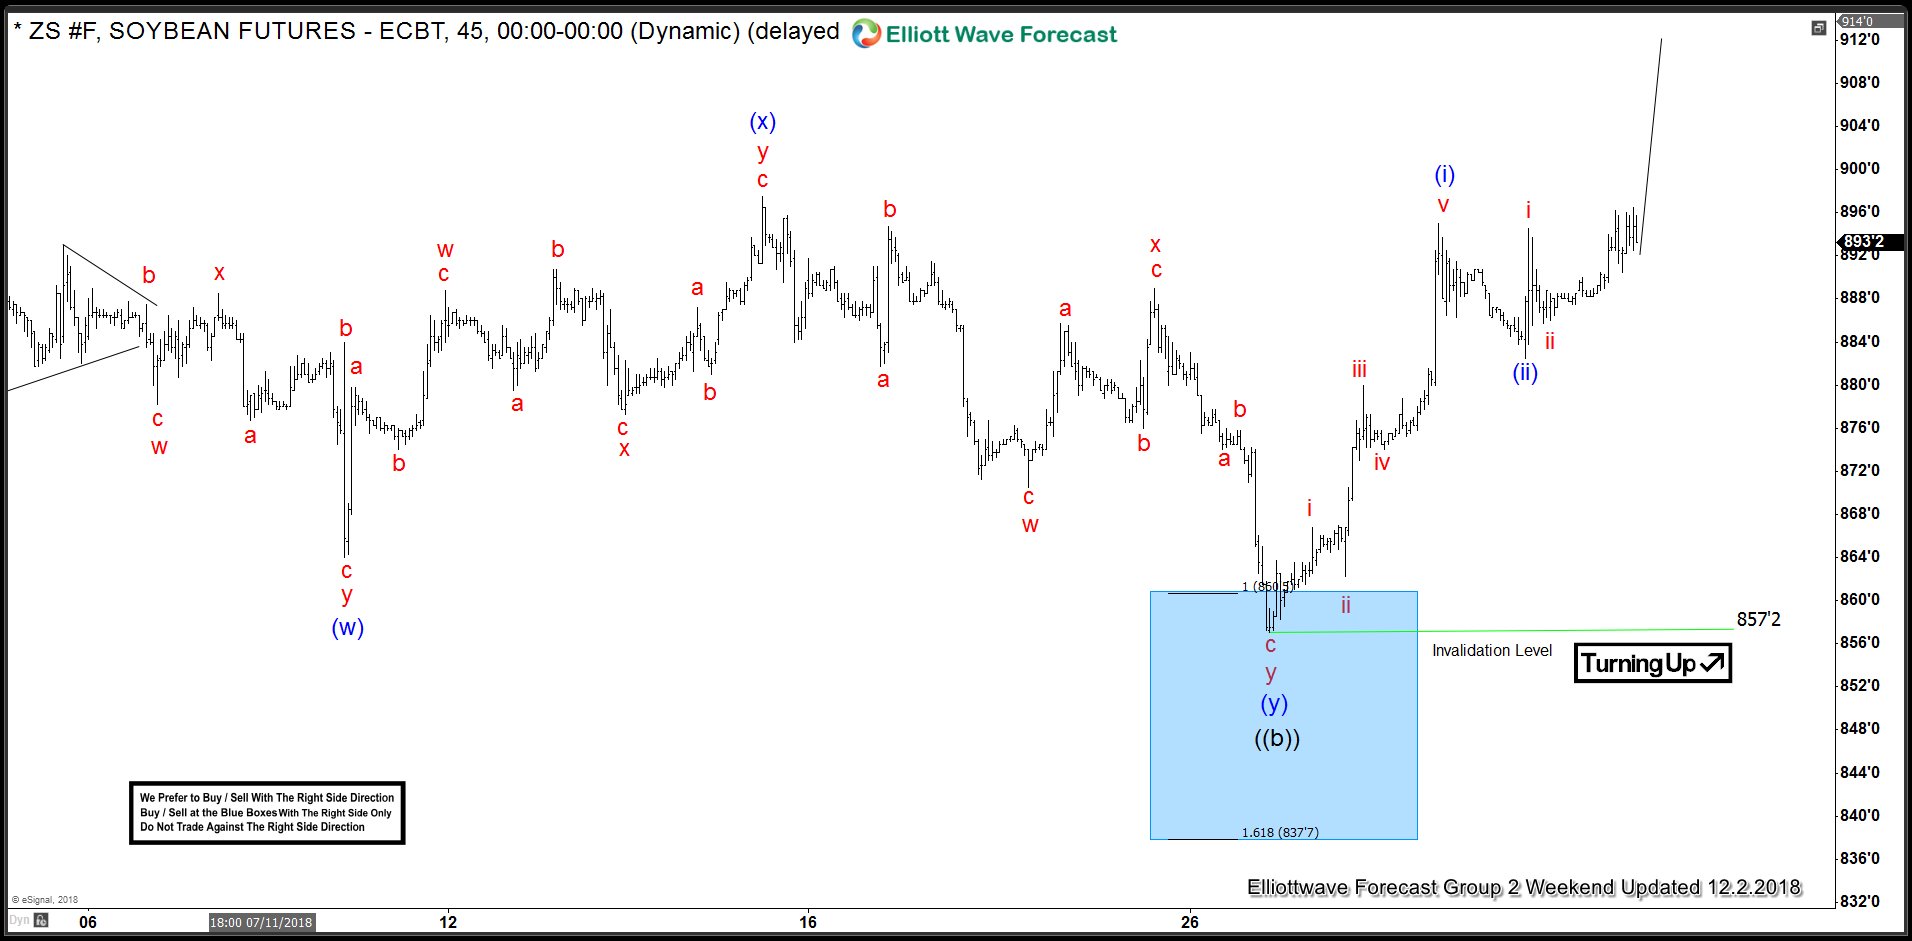
now look at this

Read the line that states…
“CLOSES ABOVE 9.65”
now this has to tell you the following
-
this person is a regular trader or Soy vs USD
-
this person is used to quoting in pips , short hand
just like i would quote US2000 as 1502 when it’s 1502.6
because on US2000 the pip is from 1502.0 to 1503.0 and the point is after the decimal place
so clearly he is saying that 9.65 is actually 9.650
so IT WOULD BE REASONABLE TO ASSUME THAT 9.650 - 9.660 = 1 pip
and 9.650 - 9.651 = 1 point
so your question
9.600 - 9.800 = 200 points = 20 pips
a bit of research goes a long way mate
this took me around 1 - 2 mins to figure out
and even though i’m an experienced trader
I HAVE NEVER TRADED SOYABEAN and haven’t a clue as to the price… ok
but yet, i figured it out in around 2mins
when you are in a situation like this again, TRY NOT TO ASK
Try to research for yourself and figure it out
so even if it’s not CLEARLY STATED as this is a pip… this is a point
WORK IT OUT
Look at the contract specification by going to the Market Watch… RIGHT CLICK click SPECIFICATION
have a read
UNDERSTAND IT
if you don’t
ask your broker
simple
does that help