Hello fellow traders. In this technical blog we’re going to take a quick look at the Elliott Wave charts of Soybeans futures $ZS_F. As our members know, Soybeans futures is having incomplete bearish sequences in the cycle from the 1784’0 peak. Current view is calling for further weakness against the 1671’7 pivot. Recently the commodity has given us another trading opportunity. We got 3 waves recovery which found sellers right at equal legs area as we expected. In the further text we are going to explain the Elliott Wave Forecast and Elliott Wave Pattern.
Before we take a look at the real market example, let’s explain Elliott Wave Zigzag pattern.
Elliott Wave Zigzag is the most popular corrective pattern in Elliott Wave theory . It’s made of 3 swings which have 5-3-5 inner structure. Inner swings are labeled as A,B,C where A =5 waves, B=3 waves and C=5 waves. That means A and C can be either impulsive waves or diagonals. (Leading Diagonal in case of wave A or Ending in case of wave C) . Waves A and C must meet all conditions of being 5 wave structure, such as: having RSI divergency between wave subdivisions, ideal Fibonacci extensions and ideal retracements.

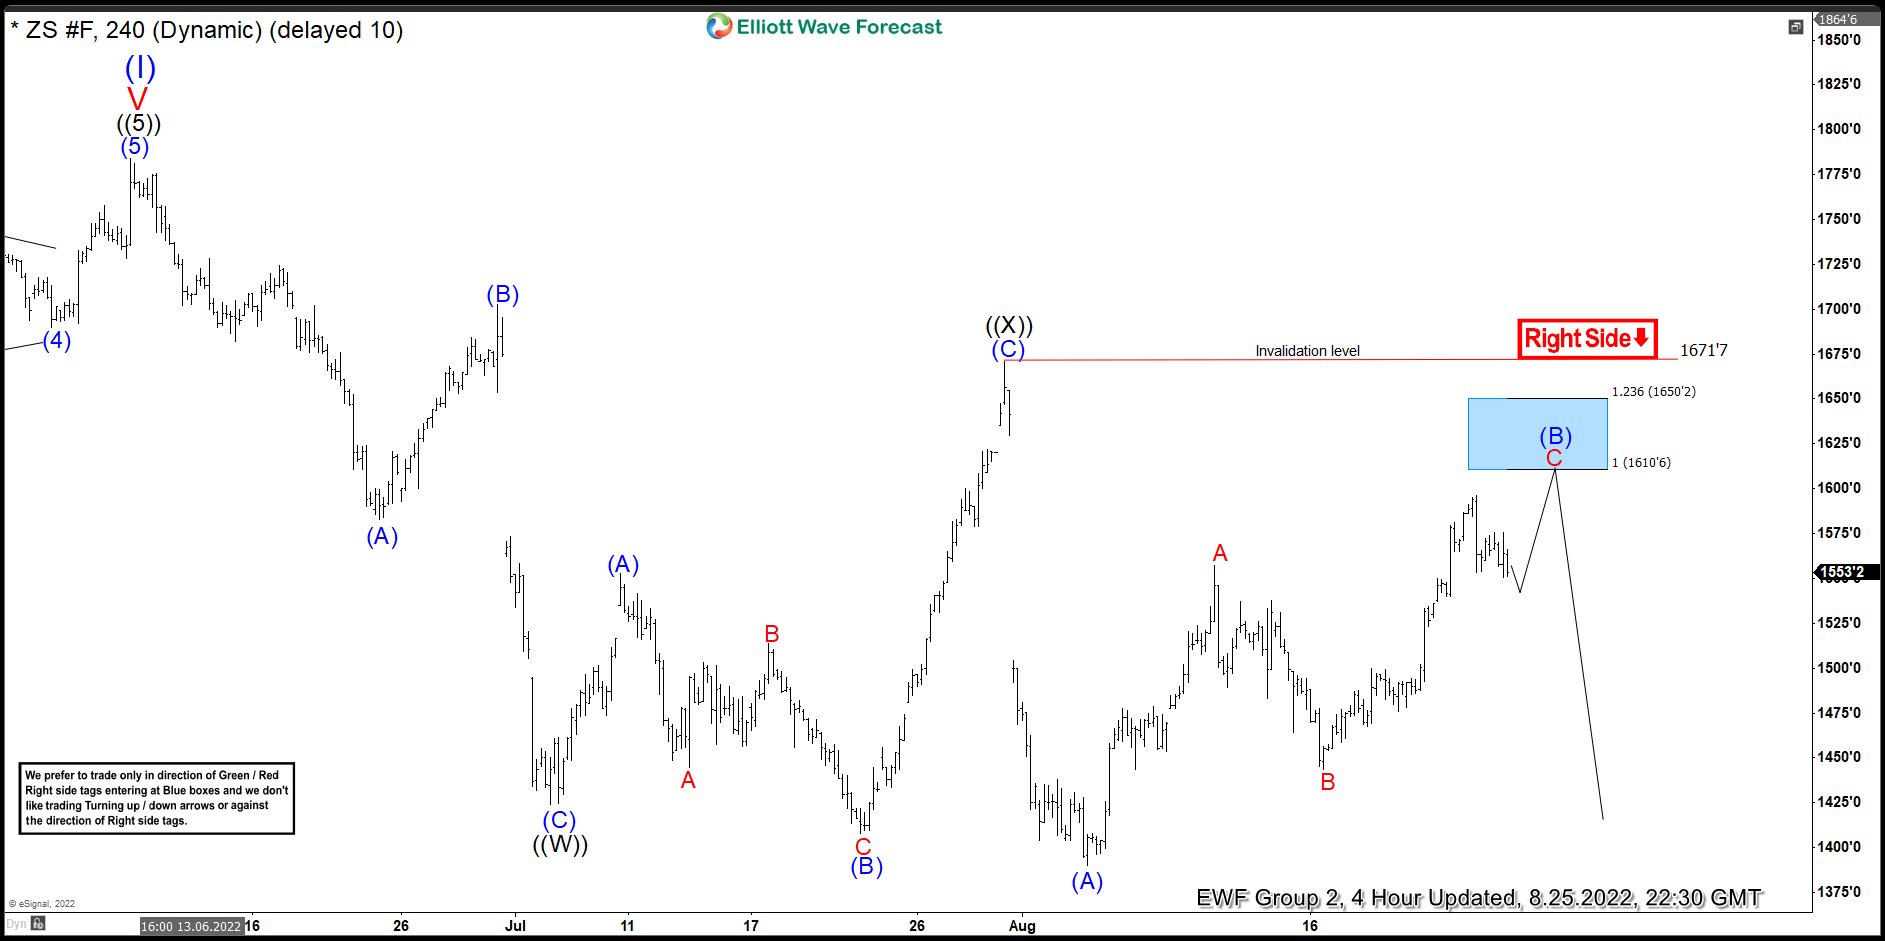
Soybeans $ZS_F Elliott Wave Analysis 08.25.2022
Soybeans futures is correcting the short term cycle from the 1671’7 peak. Recovery is unfolding as potential Elliott Wave Zig Zag Pattern and looking incomplete at the moment. The price is showing higher high from the lows, suggesting (B) blue recovery can see more upside toward 1610’6-1650’2 area. Target for ending point of (B) blue is got by measuring equal legs from the low A red related to B red. As the commodity is currently in bearish cycle, we expect sellers to appear at the mentioned zone for further decline toward new lows ideally or for a 3 waves pull back at least .Once pull back reaches 50 Fibs against the B red low, we will make short position risk free ( put SL at BE) and take partial profits. As our members know Blue Boxes are no enemy areas , giving us 85% chance to get a reaction.
Reminder: You can learn about Elliott Wave Rules and Patterns at our Free Elliott Wave Educational Web Page.
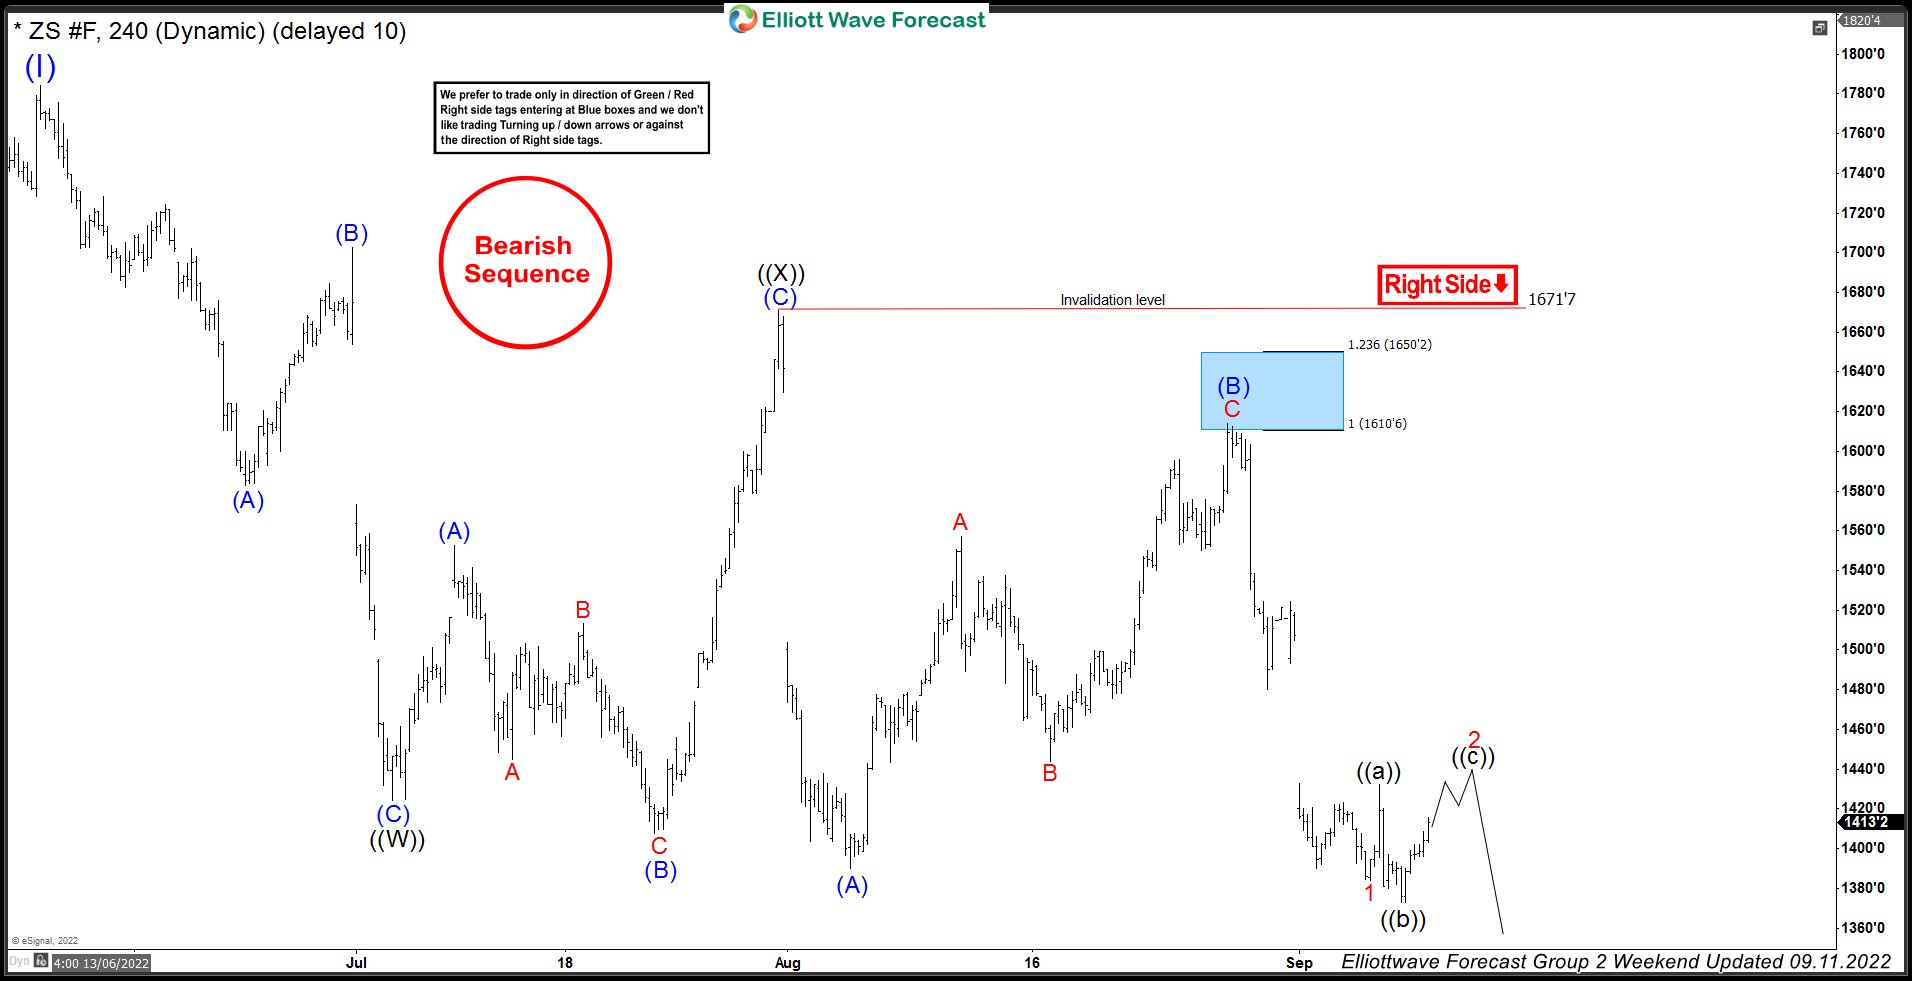
Soybeans $ZS_F Elliott Wave Analysis 09.07.2022
The commodity made rally toward target area and found sellers as expected. Recovery (B) blue ended at 1615’1 high. Soybeans made sharp decline from the Blue Box (selling zone) breaking toward new lows. As a result, members who took short trades mad positions risk free. ( Put SL at BE) and took partial profits. Decline from the 1615’1 high looks impulsive and we are now most likely doing flat in 2 red recovery.
Keep in mind market is dynamic and presented view could have changed in the mean time. You can check most recent charts in the membership area of the site. Best instruments to trade are those having incomplete bullish or bearish swings sequences.We put them in Sequence Report and best among them are shown in the Live Trading Room.
Source: Soybeans Features ( $ZS_F ) Another Selling Opportunity