Hello fellow traders. In this article we’re going to take a quick look at the Elliott Wave charts of SPX ( S&P500) , published in members area of the website. As our members know SPX is showing higher high sequences in the short term cycle from the October 13th low. The index is looking for another push up toward 4080.4+ area ideally. Recovery looks incomplete and we expect to see more short term strength. Recently SPX made a short term pull back that has reached its target area and found buyers as expected. In the further text we are going to explain the Elliott Wave Forecast.
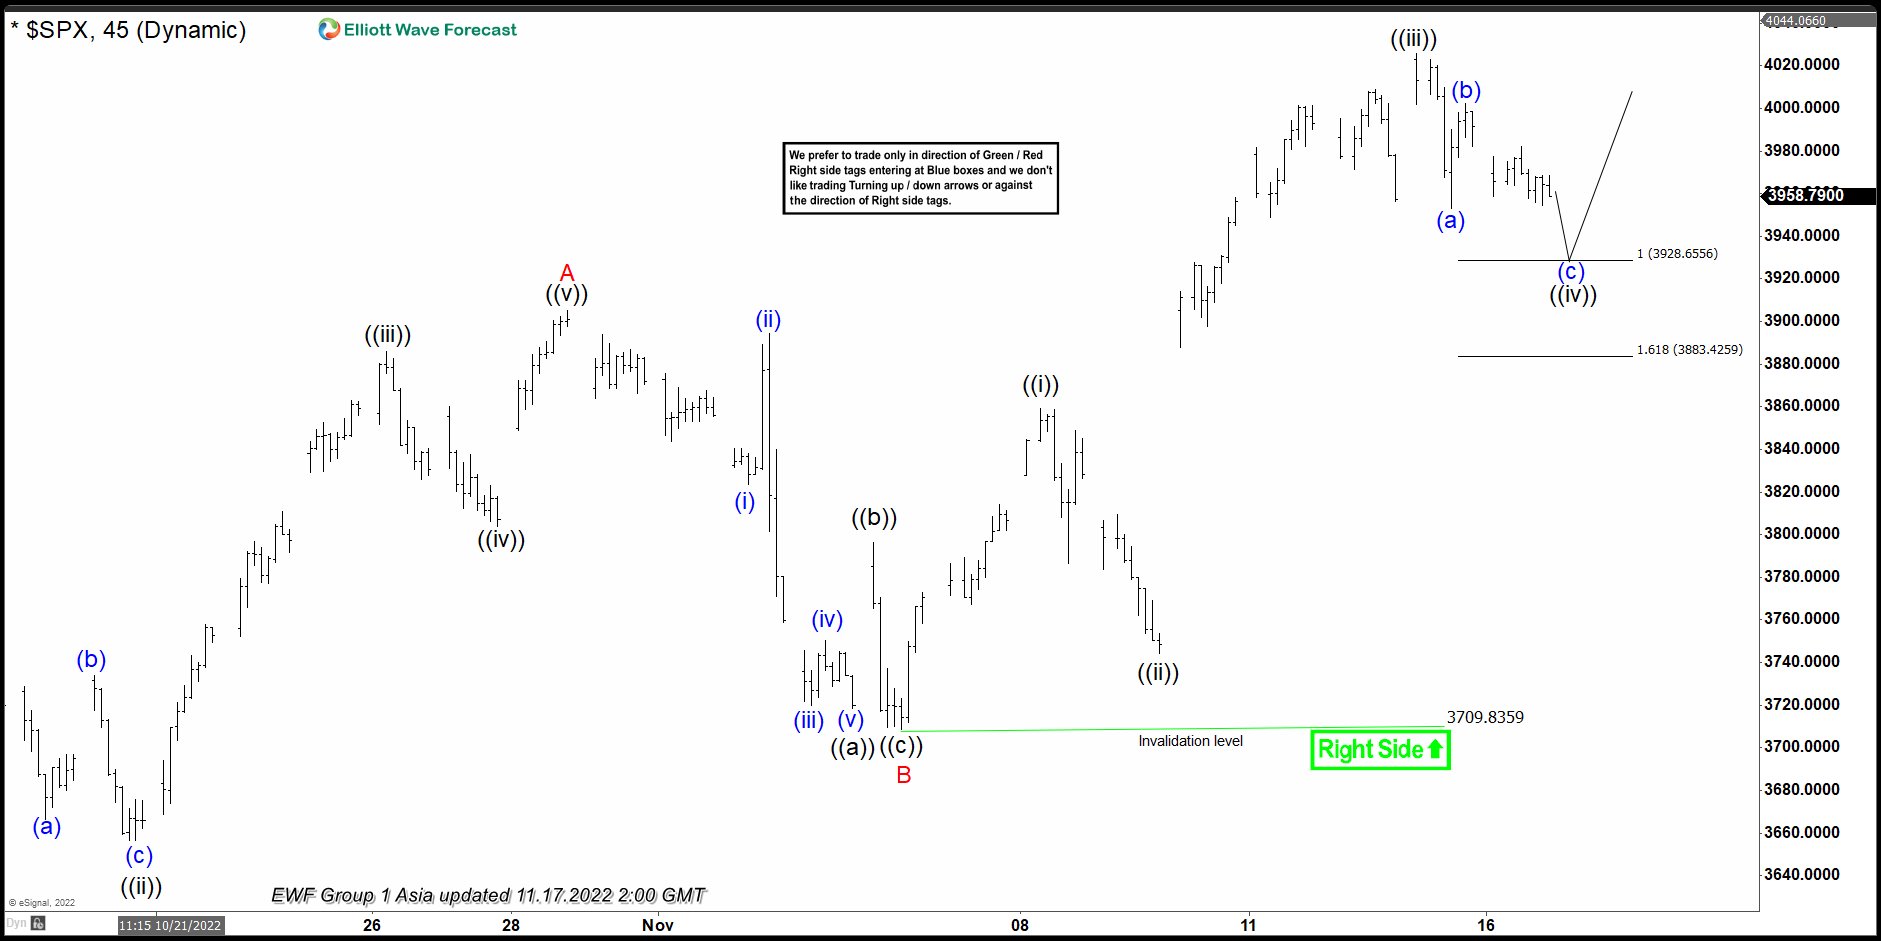
SPX Elliott Wave 1 Hour Chart 11.17.2022
SPX is proposed to be doing Elliott Wave Zig Zag pattern within the cycle from the October 13th Low. Structure is still incomplete. SPX has not reached extremes from the 10.13. low. Besides that , we got only 3 waves up in the cycle from the 3709.8 low which suggests another wave up is still missing. So, current view suggests wave C red is still in progress when we are now in ((iv)) of C. Once current short term pull back completes we expect to see another push up toward 4080.4 area .We expect to see more downside in near term toward 3928.6-3883.4 area. Buyers should ideally appear at the marked zone for the further rally toward new high ideally or for a 3 waves bounce at least.
You can learn more about Elliott Wave Patterns at our Free Elliott Wave Educational Web Page.
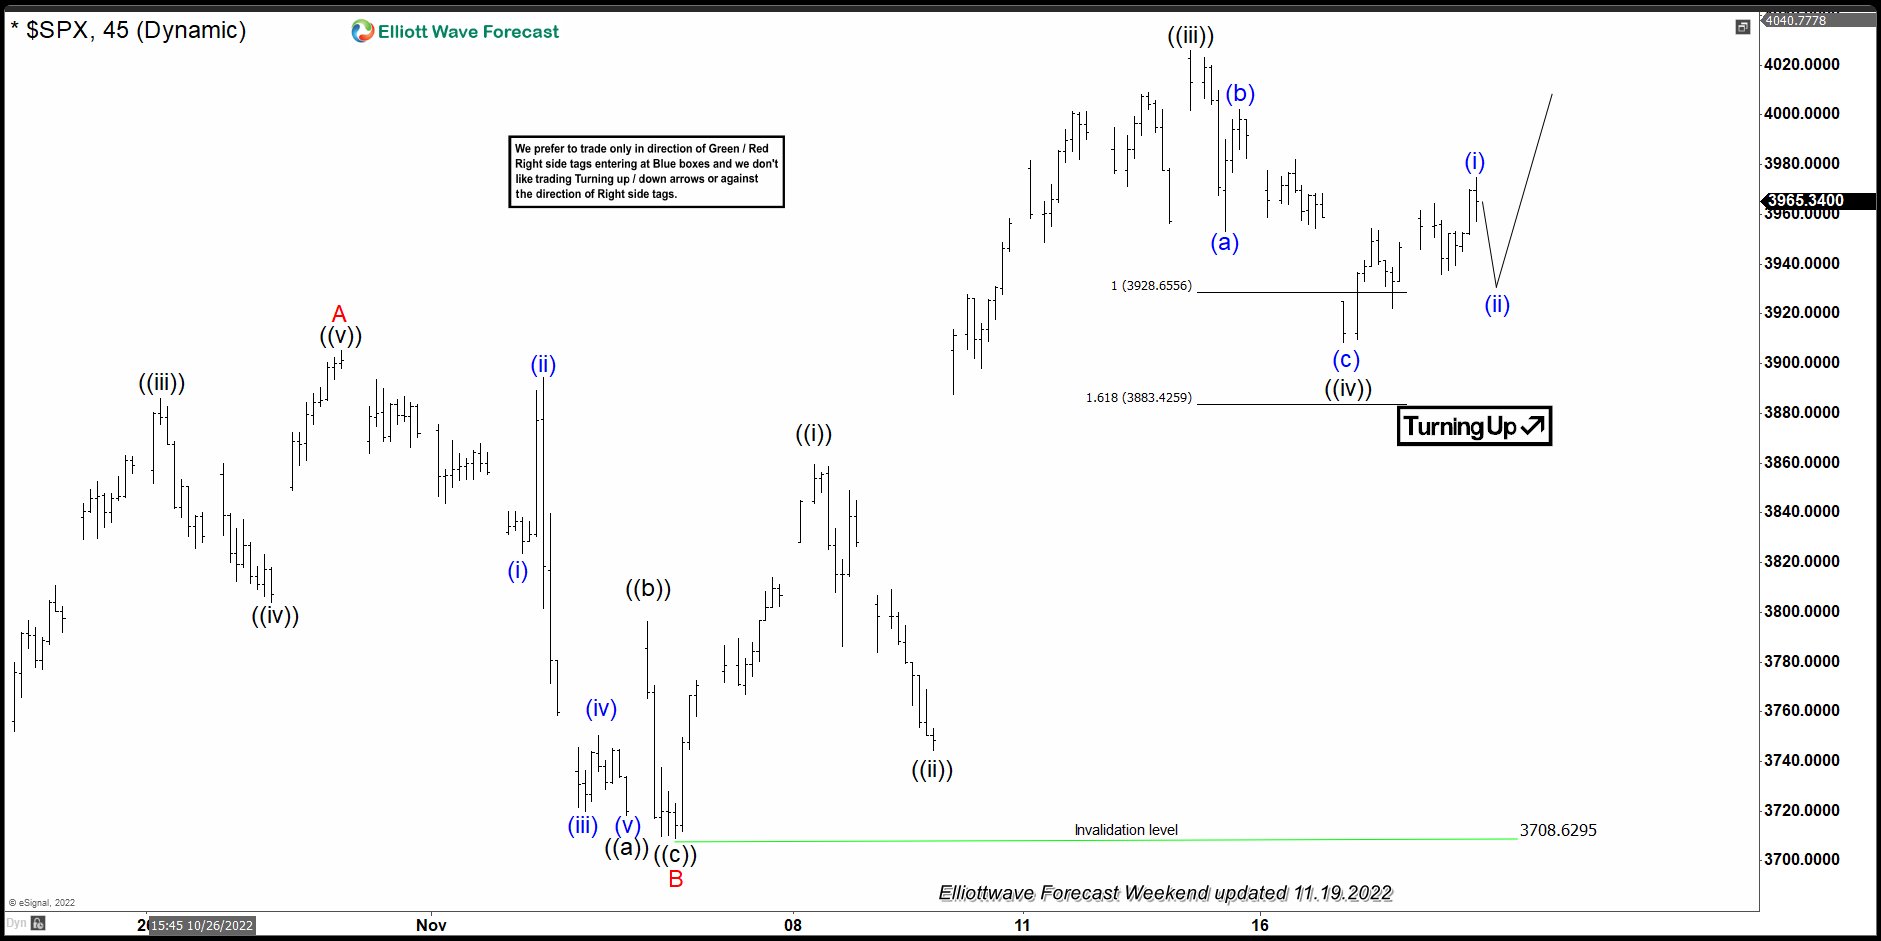
SPX Elliott Wave 1 Hour Chart 11.19.2022
Pull back reached our target zone at 3928.6-3883.4 ( buyers area). SPX found buyers at that zone and we are getting reaction from there. Rally made enough separation from the lows. As a result, any longs from there should be risk free already and partial profit taken. Wave ((iv)) can be done at 3907 low and we should be ideally trading within wave ((v)) toward 4080.4 area. Alternatively if 3907 low gets broken then we can see 7 swings in wave ((iv)) .
Keep in mind that market is dynamic and presented view could have changed in the mean time. You can check most recent charts with target levels in the membership area of the site Best instruments to trade are those having incomplete bullish or bearish swings sequences. We put them in Sequence Report and best among them are shown in the Live Trading Room
Source: https://elliottwave-forecast.com/stock-market/spx-elliott-wave-view-forecasting-path/