In this technical blog, we will look at the past performance of 1 hour Elliott Wave Charts of SPY, which we presented to members at the elliottwave-forecast. In which, the rally from 27 January 2021 low unfolded as an impulse structure. And showed a higher high sequence favored more upside extension to take place. Therefore, we advised members not to sell the ETF & buy the dips in 3, 7, or 11 swings at the blue box areas. We will explain the structure & forecast below:
SPY 1 Hour Elliott Wave Chart
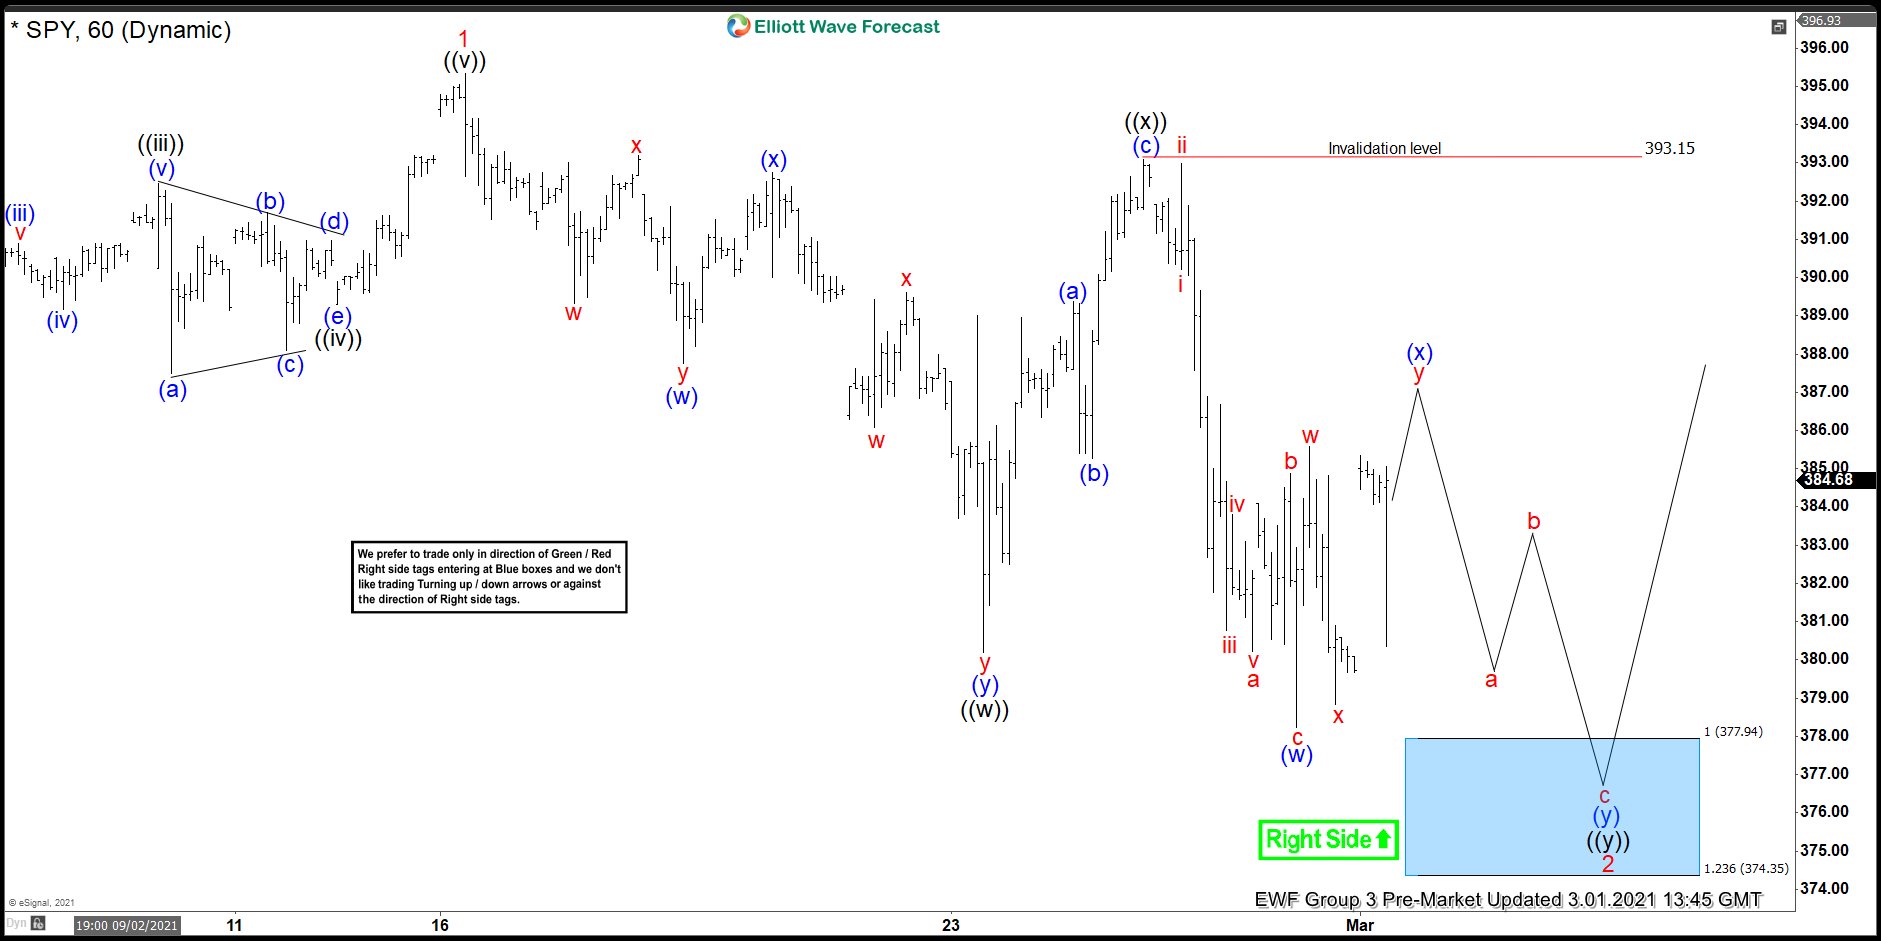
Above is the 1 hour Elliott wave Chart of SPY from the 3/01/2021 Pre-Market update. In which, the SPY ended the 5 wave impulse rally in wave 1 at $395.35 high. Down from there, the ETF made a pullback in wave 2. The internals of that pullback unfolded as a double three structure where wave ((w)) ended at $380.20 low. Wave ((x)) bounce ended in 3 swings at $393.10 high and wave ((y)) was expected to reach the $377.97- $368.59 100%-161.8% Fibonacci extension area of ((w))-((x)). From there, buyers were expected to appear looking for further upside.
SPY 1 Hour Elliott Wave Chart
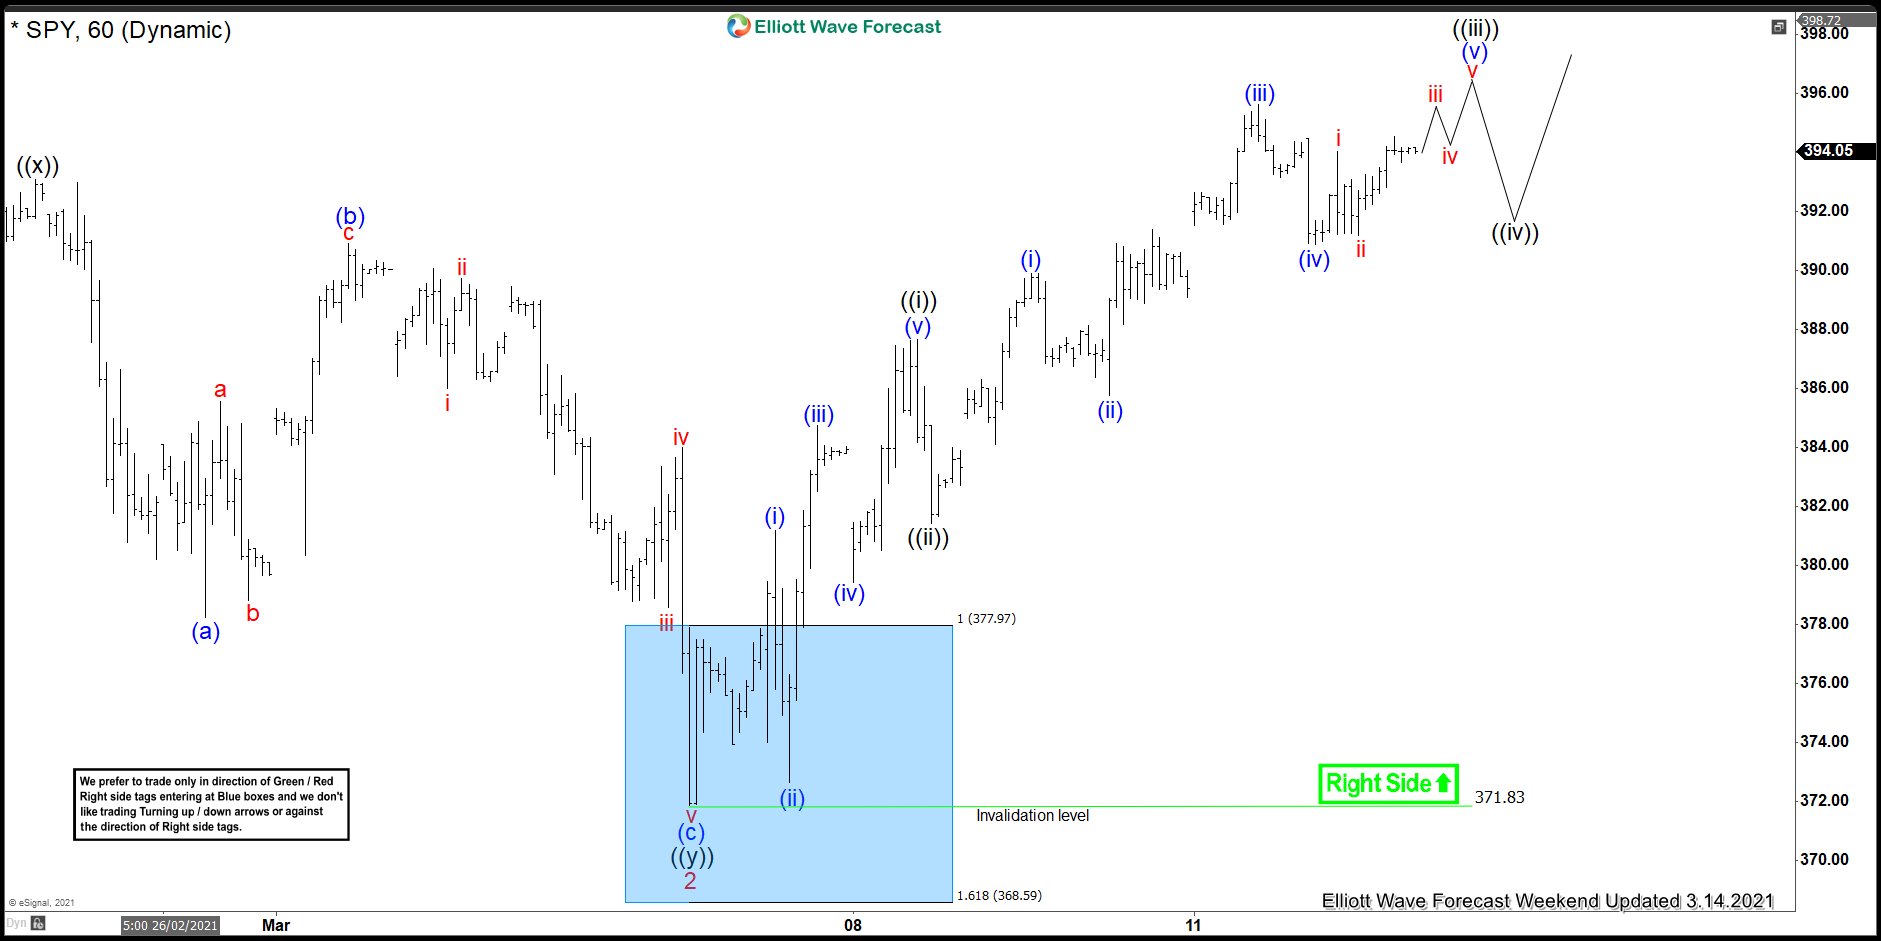
Here’s the 1 Hour Elliott wave Chart of SPY from the 3/14/2021 Weekend update. In which, the ETF managed to reach the blue box area at $377.97- $368.59 & showing a strong reaction higher taking place from the blue box area. Right after ending the double three correction within the blue box area at $371.83 low. And breaking to new highs as expected. Allowed members to create a risk-free position shortly after taking the long positions at the blue box area.
Source: SPY Another Pullback Offered Another Buying Opportunity