SPY: The Decision Time is Coming Soon
The Index is within the Grand Super Cycle and is showing a clear five waves structure. The Elliott wave Theory states that after five waves a three waves pullback will happen to correct the entire cycle. The following chart is a representation of the idea, which is the basic wave structure within the theory.

The above graphic shows a five waves cycle in which each smaller cycle subdivides in five waves.This is three cycles higher with the trend and then two cycles against the trend to complete the five waves. Then a big correction of the five wave cycle in a form of an ABC or 5-3-5.
SPY is showing a visible Five waves since the all-time lows and soon needs to decide if the Index will crash into the 185-87 area, or the Index will continue higher into the 600-700 area. At this stage, it is hard to define only looking at the Index which path will be taking place.
Let’s take a look and explain the possible two paths and what supports each one of the paths.
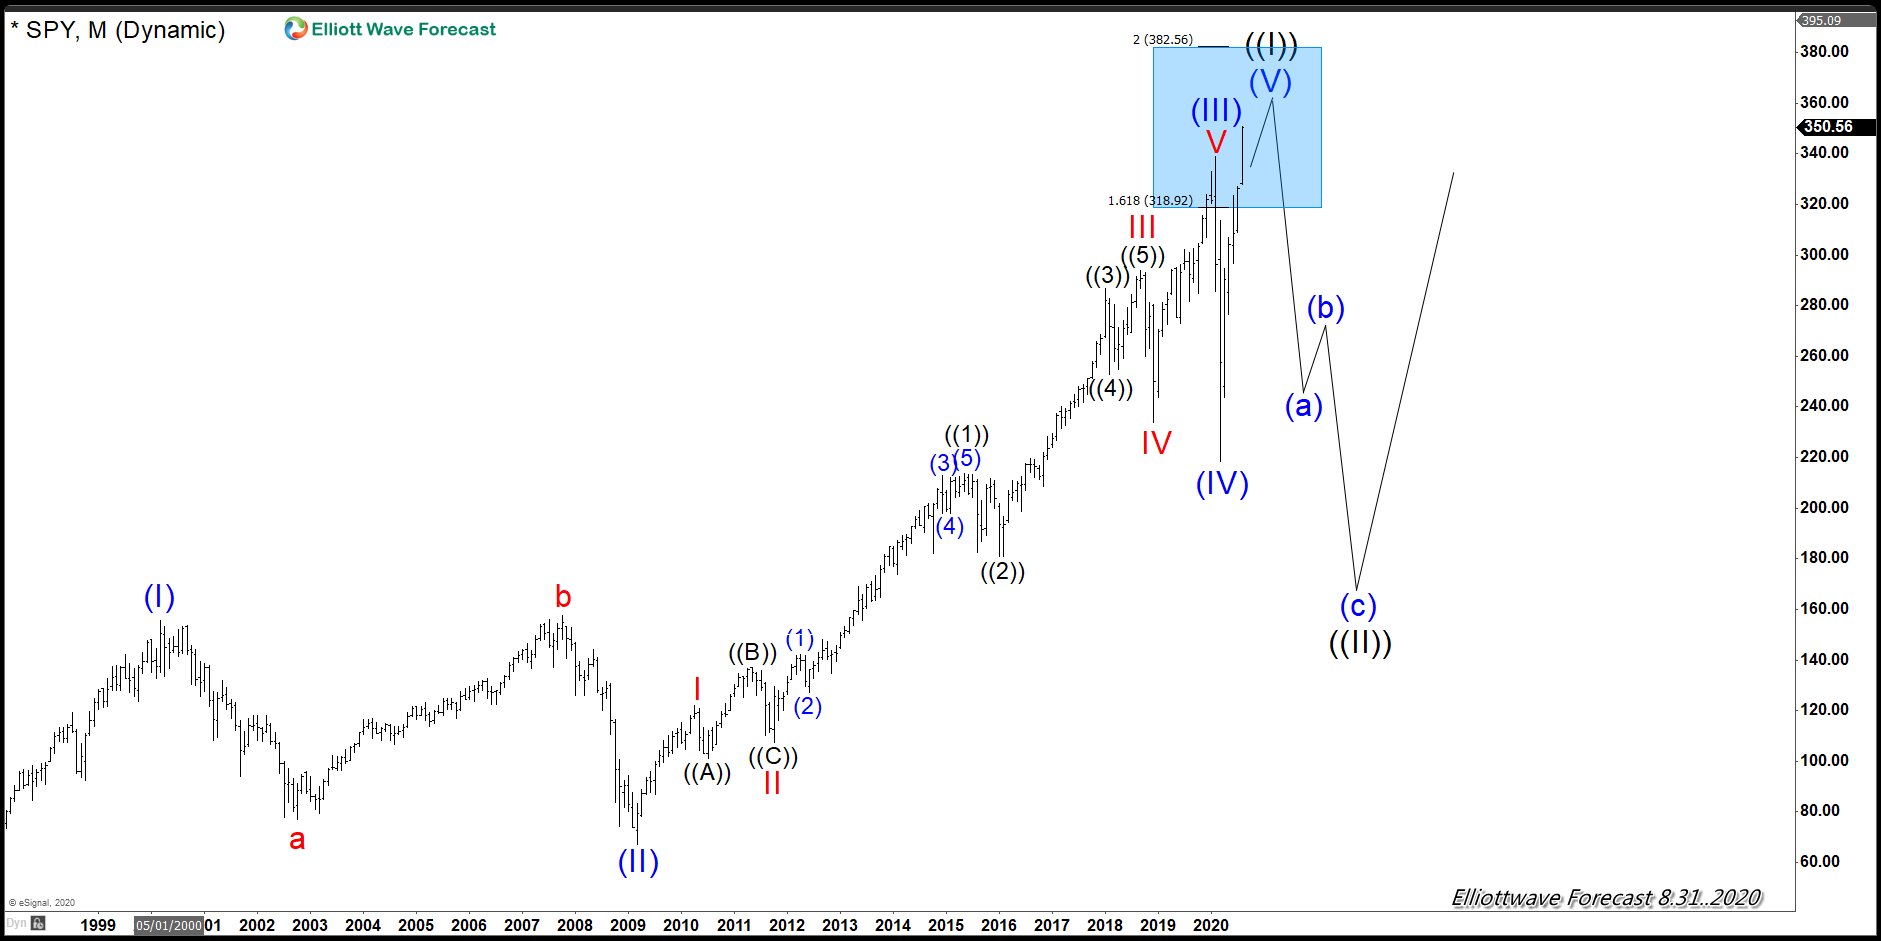
Path 1: The Five waves advance from all-time lows. The Index can be labelled, as five waves and it is clear the Index is showing three channels since the lows. The First channel runs from the all-time lows until the (I) peak in 2000, then the second channel runs from the lows at (II) in 2009 until (III) which happens in 2020.
The Idea of three channels higher and then two channels lower in wave (II) and (IV), makes a classic five waves advance which will be calling for the biggest sell-off we have ever seen. The advance provides extension because when we look at the extension between wave (I) and (II) clearly pass the 1.618 extension, which is one requirement in our rules. One negative aspect is the idea of wave (II) took nine years and wave (IV) only took two months, which something which is not ideal within the Elliott wave Theory.
SPY Monthly Chart - Elliott Wave Path 1:
Path 2: The Nest: The Elliott wave Theory provides a concept that is called a Nest. A Nest is a series of five waves advance before acceleration takes place within the powerful wave ((3)) of III of (III). The following chart represents the Nest within the Elliott Wave Theory.
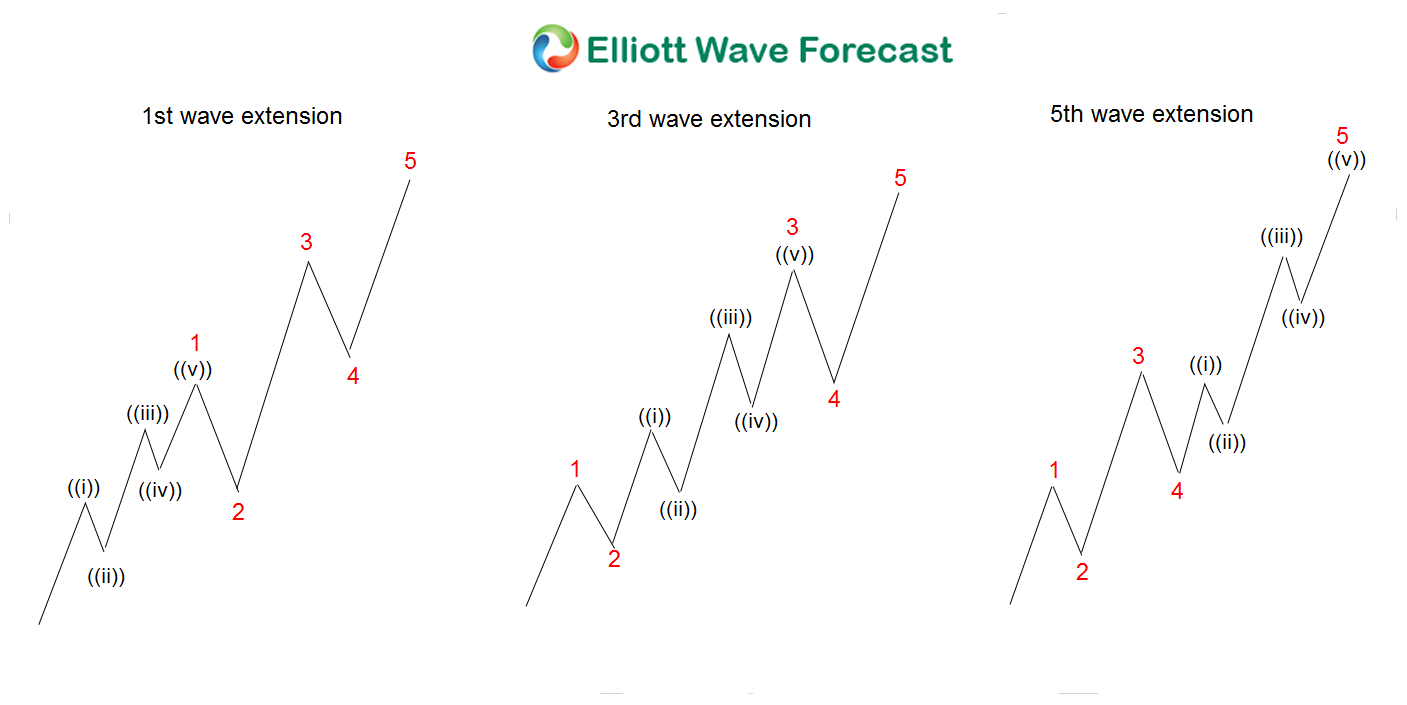
The above graphic shows an extension in either wave one, three & five. The Idea of the nest happens when the trend is powerful, and one side of the Market keeps extending leaving the other side without a chance.
The Index ETF (SPY) can be label as a nest, as we are showing in the following chart:
SPY Quarterly Chart - Elliott Wave Path 2:

The Nest will have the Index trading within wave ((1)) of III of (III). This will take the Index into the 362-414 area first. Then the 490-550 later before the Index can trade close to the 700 levels.
As we mentioned above, the decline this year is too shallow and lacking time which supports the nest. Most of the time wave II of (III) is shallow and fast, which fits the decline this year. Wave (II) in the Index took nine years. In the first path 1 non nest scenario, wave (IV) only took two months, something which is not normal.
As mentioned above it is hard to determine which path the Index will be taking. However looking at the Multi-Market correlation, the nest is very well supported. Many companies will go out of the Market if path 1 will be taking place. All the Airlines will go out of business. This is because there isn’t enough space to support a decline like path 1 is calling.
As we always say, The Elliott Wave Theory is great but was developed in the 1930’s. We now are trading in 2020. Consequently, we have more tools and opportunities to see a Global Market. We can compare them and look for the edge to create a better forecast. We believe path 2 makes more sense while we need to understand path 1 and trade smart.