Hi All,
I’m monitoring currency pairs to trade and I see a strange IDR/AUD movement below. My question is:
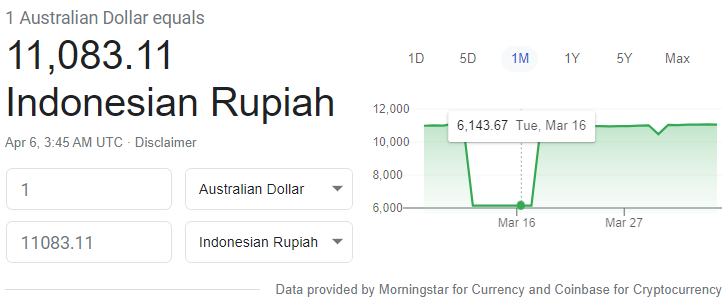
How could that happen with this pair? Checking both AUD and IDR with other currencies do not show a similar pattern.
Is there a good app that could provide an alert if a particular currency pair crosses a certain threshold rate? I tried many apps that claimed to do so but none actually pops any alert message.
IDR/AUD is not as liquid as alot of other pairs so you would expect some larger than ‘normal’ moves. Looking at a proper chart for this pair there was a large change in the price over March 2020 - around the time Coronavirus really kicked off and we seen a massive impact on equities and some currencies.
Regarding your second question, I would recommend “TradingView”. Definetly the best web based charting software I have used.
Hi TraderEvolved,
The drop in AUD value for several days happened recently mid March 2021, not 2020. I got the data just by googling “AUD IDR”, and we can see AUD losing around 50% of its value. Strangely if I check the pair’s rates at Yahoo’s site, the same period shows AUD only having just 10% of it’s value. Imagine the profit trading on this pair.
For the app, do you know one for mobile phone? I don’t do much chart analysis, just wanted an app that can pop an alert if the rate of some currency pairs crossed a certain level. In this pandemic era with currencies oscillating and rebounding back, my strategy is just to buy when a currency is significantly cheaper than usual, and then sell when it rebounded.
Never seen this in forex before but never seen a chart on such a thinly traded currency as IDR.
My experience with small-cap stocks in the stock market however tells me that TA on thinly traded stuff is just waste of time - long periods of flat prices, vertical drops, flat prices, vertical rises. Massive spreads undermine profitability. Ugh.
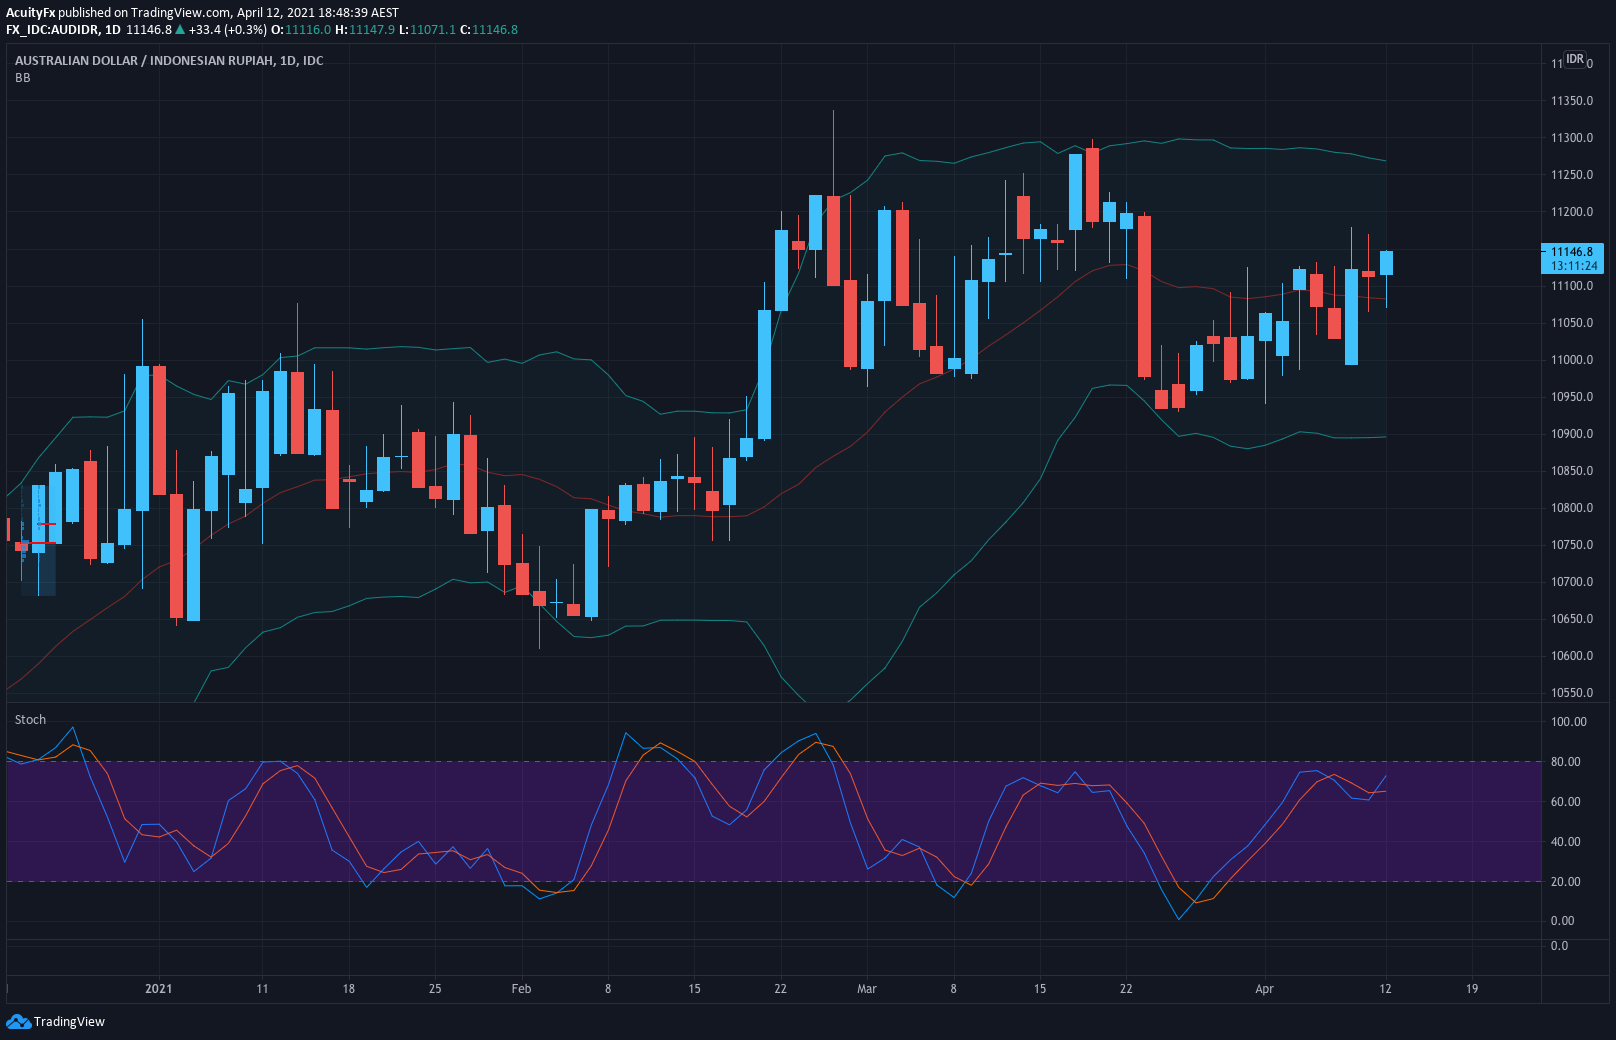
My bad… I thought you were looking at 2020 data. In that case it seems it might just be an issue with the broker data feed that you are looking at. My chart for March on AUDIDR has no such dip at all…
Regarding the phone app, Trading view does have a mobile app version which you can set alerts off.
Ok will try the app…
Strange that we have data showing very different results. The data I use is from Google, which quotes from “Morningstar” and which shows similar pattern to Yahoo data.
From my experience the data looks aligned to local bank when I traded the AUD.
Due to the Covid all currencies are fluctuating. Several months ago AUD was at 75%% of current rates. Was able to capitalize when AUD rebounded and made some profit. Would have been much bigger profit if there’s no restrictions on maximum foreign currency that can be purchased per month.
It’s not easy to know in which direction the market is moving. It can take any turn it wants. The volatility is something no trader can escape and it is better to be prepared for anything all the time.
Yes, I agree this is quite strange. But as far as I can guess, it is all because of the covid-19 pandemic. All the currencies are showing unreasonable fluctuations and the worst part is that we can’t do anything about it.