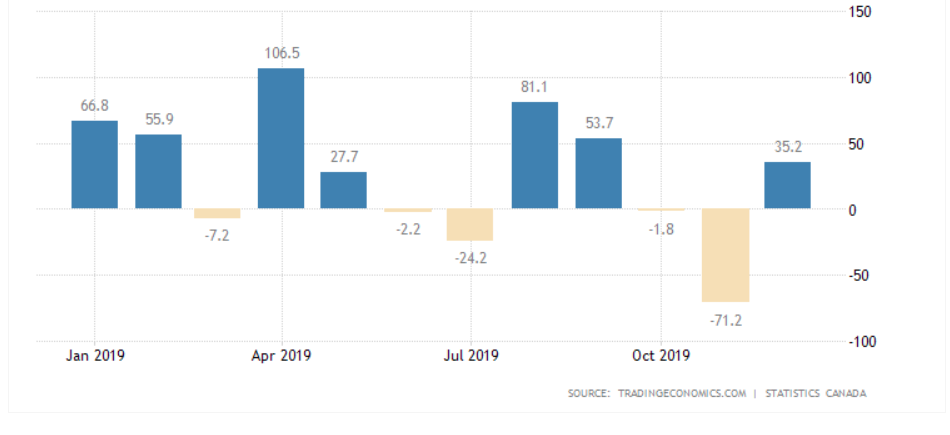
Bank of Canada will have its first rate meeting this year on January 22. Recent strong jobs data and high inflation likely allows BOC to maintain a steady rate. Latest jobs report from Canada shows a strong rebound after two straight monthly declines. During the month of December 2019, Canada’s economy created 35,000 jobs. What’s more impressive is the fact that the gain mostly was in full-time employment. Private sector was especially strong wit the addition of 57,000 jobs in December. This makes 2019 as the second best year of job creation since the financial crisis in 2007. Unemployment rate also dropped to 5.6%.
The latest jobs data came as a a reprieve after the awful result in November. The November’s jobs data was particularly alarming as it suggests the economy lost 71,000 jobs. November 2019 was the worst month in more than a decade.
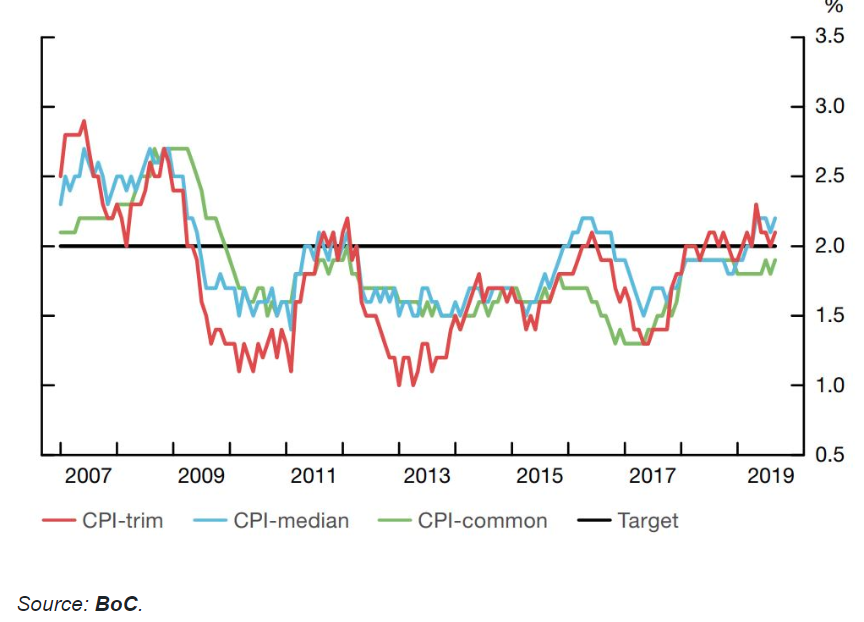
Inflation remains high. Headline annual inflation is at 2.2% while the core inflation is at 1.9%. This is consistent with the central bank’s target and indicates that the economy is operating at near capacity.
In the latest rate meeting, BOC has said that their biggest concern was the global trade wars. However, relationship between the US and China have since thawed and phase 1 trade deal should be signed this week. The US has rolled back some of their tariffs and take out China from the currency manipulator designation. The conditions should allow BOC to maintain the same monetary policy, providing underlying support to Canadian dollar. In fact, if inflation stays persistently high and starts to pick up, the central bank might even need to hike the rate.
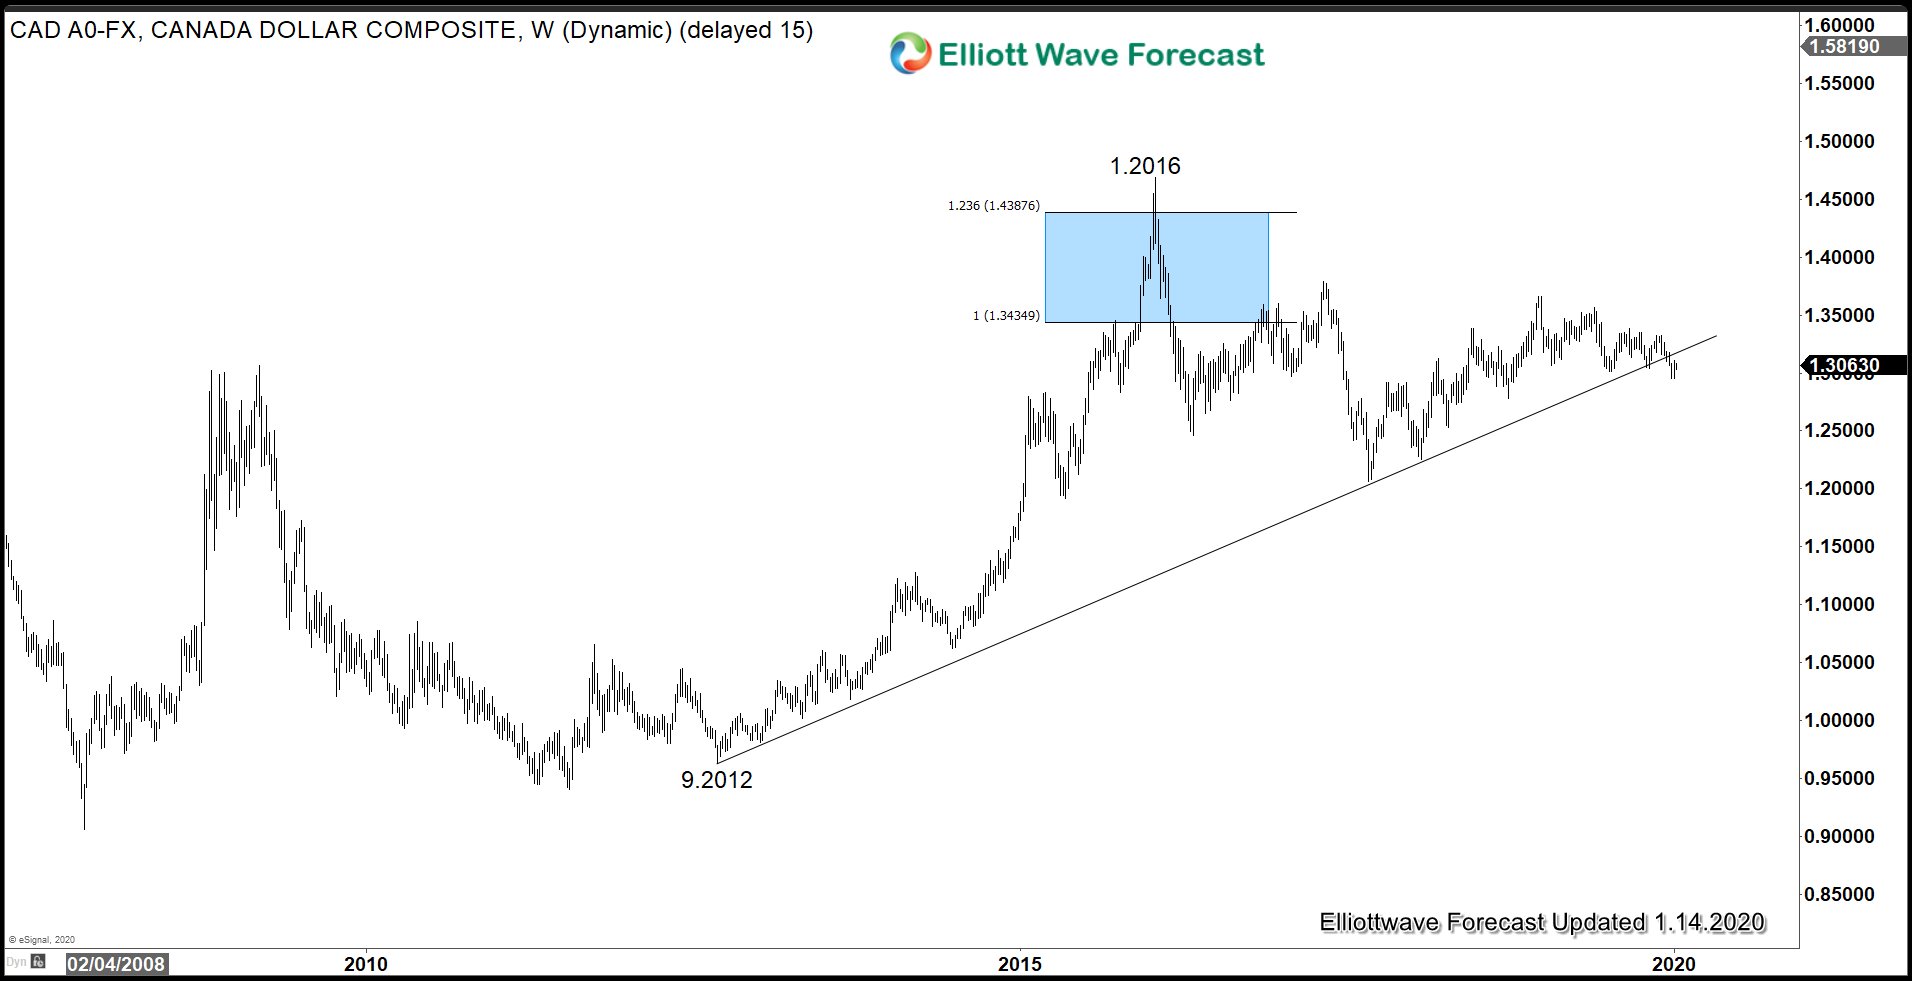
Canadian Dollar (USDCAD) Broke Bullish Trend Line From 2012 Low

The weekly chart of USDCAD above shows the pair rallies in 3 swing from Dec 2007 low and ended the rally on January 2016 near 123.6% level. Pair since then has broken below the rising bullish trend line from September 2012 low. This may indicate the pair can see further weakness in coming weeks / months.
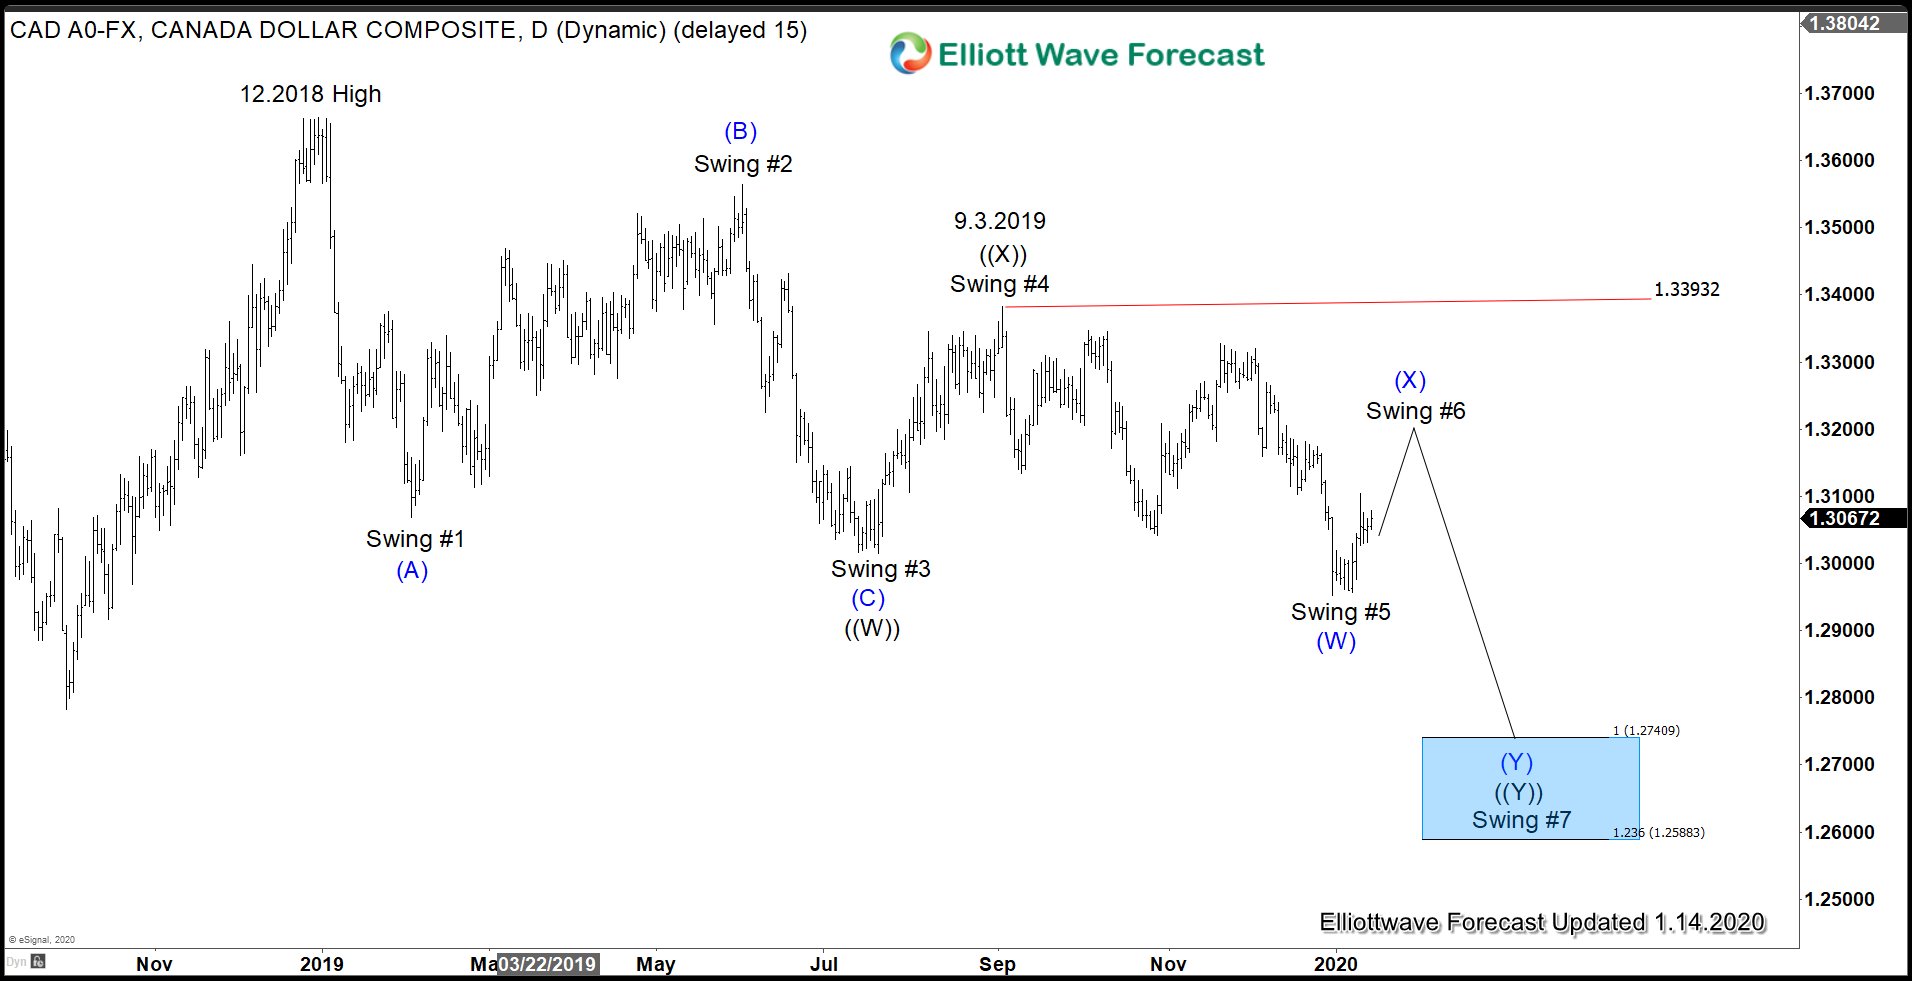
Canada Dollar (USDCAD) Shows Bearish Sequence From 2018 High

The Daily Chart of USDCAD above shows the pair has 5 swing Elliott Wave bearish sequence from December 2018 high favoring further downside. Pair is in the process of correcting the decline from Sept 3 high (1.338) within swing #6 in 3, 7, or 11 swing. While the rally fails below 1.338, pair should extend lower to complete 7 swing double three Elliott Wave structure towards 1.258 - 1.274 area.

