In this technical blog we’re going to take a quick look at the Elliott Wave charts of Sugar (SB_F) published in members area of the website. SB_F ended a cycle from 04.13.2022 peak as a Zigzag Elliott wave structure. and bounced. Based in correlation with other commodities and US Dollar Index calling for more upside, we called for the bounce to fail below 04.13.2022 peak in 3 or 7 swings and Sugar to resume the decline. In the remainder of the article, we are going to show some charts from members area of Elliottwave-Forecast to show how we forecasted Elliott wave path and then the decline which followed.
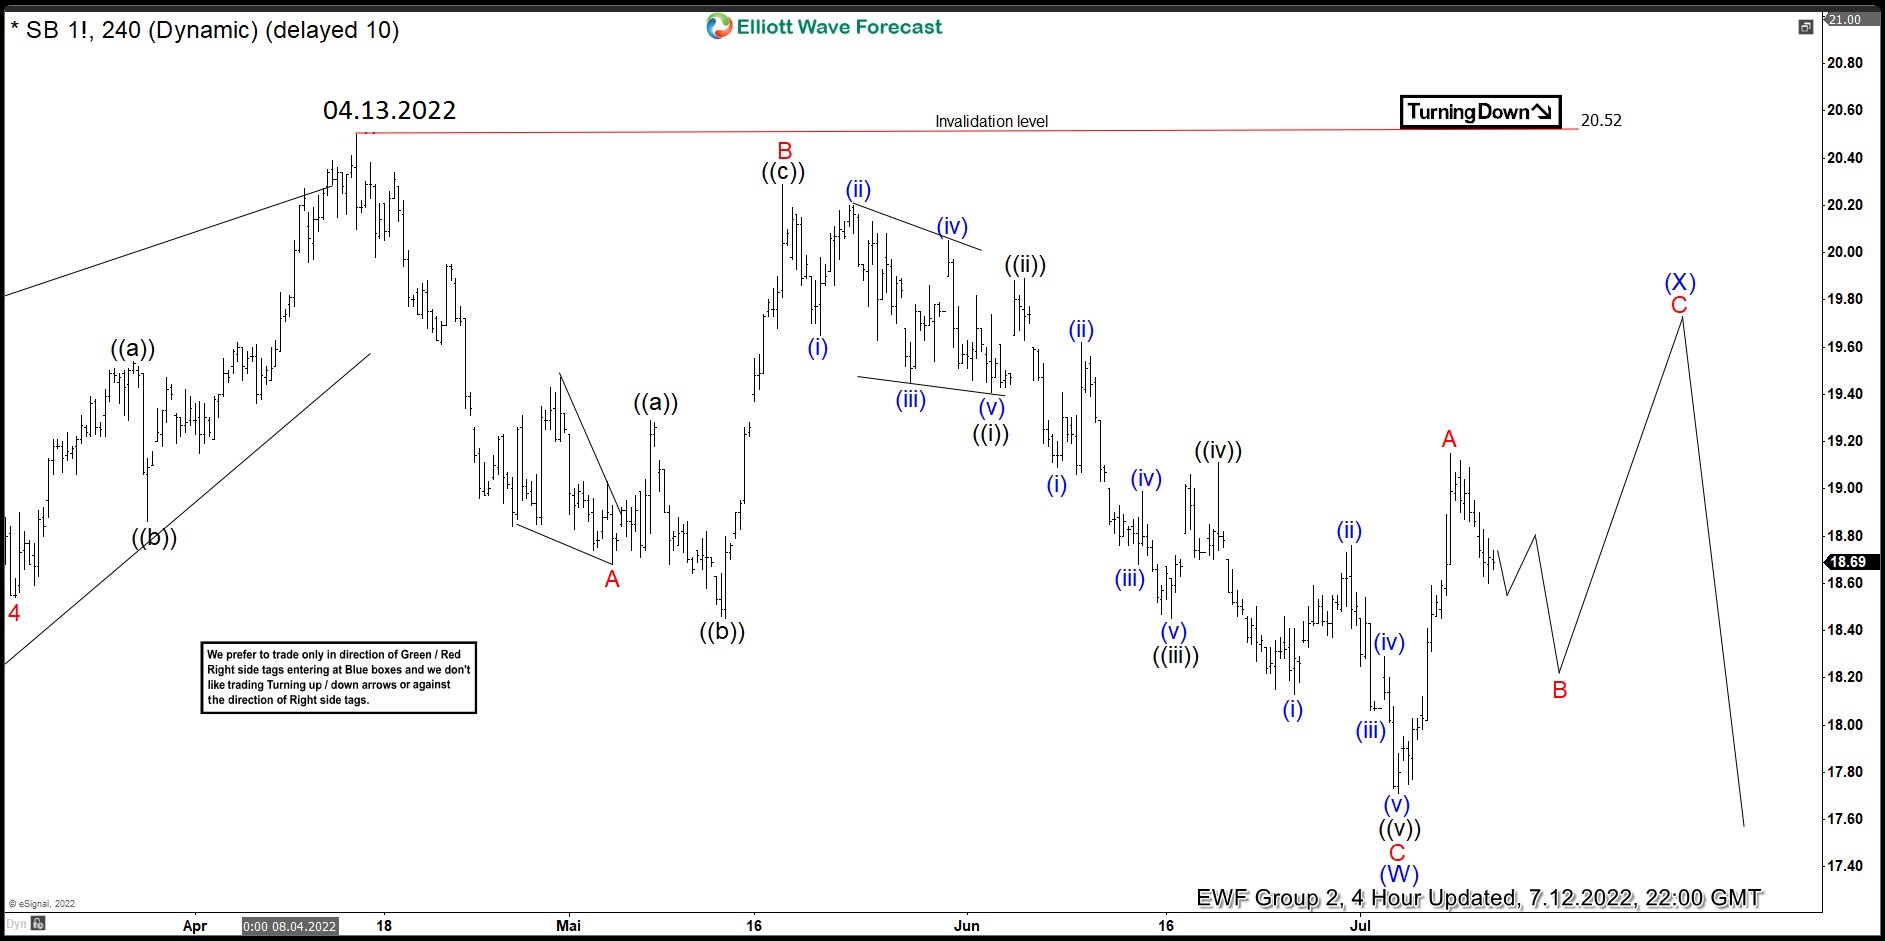
Sugar (SB_F) 12 July 4 Hour Elliott Wave Update
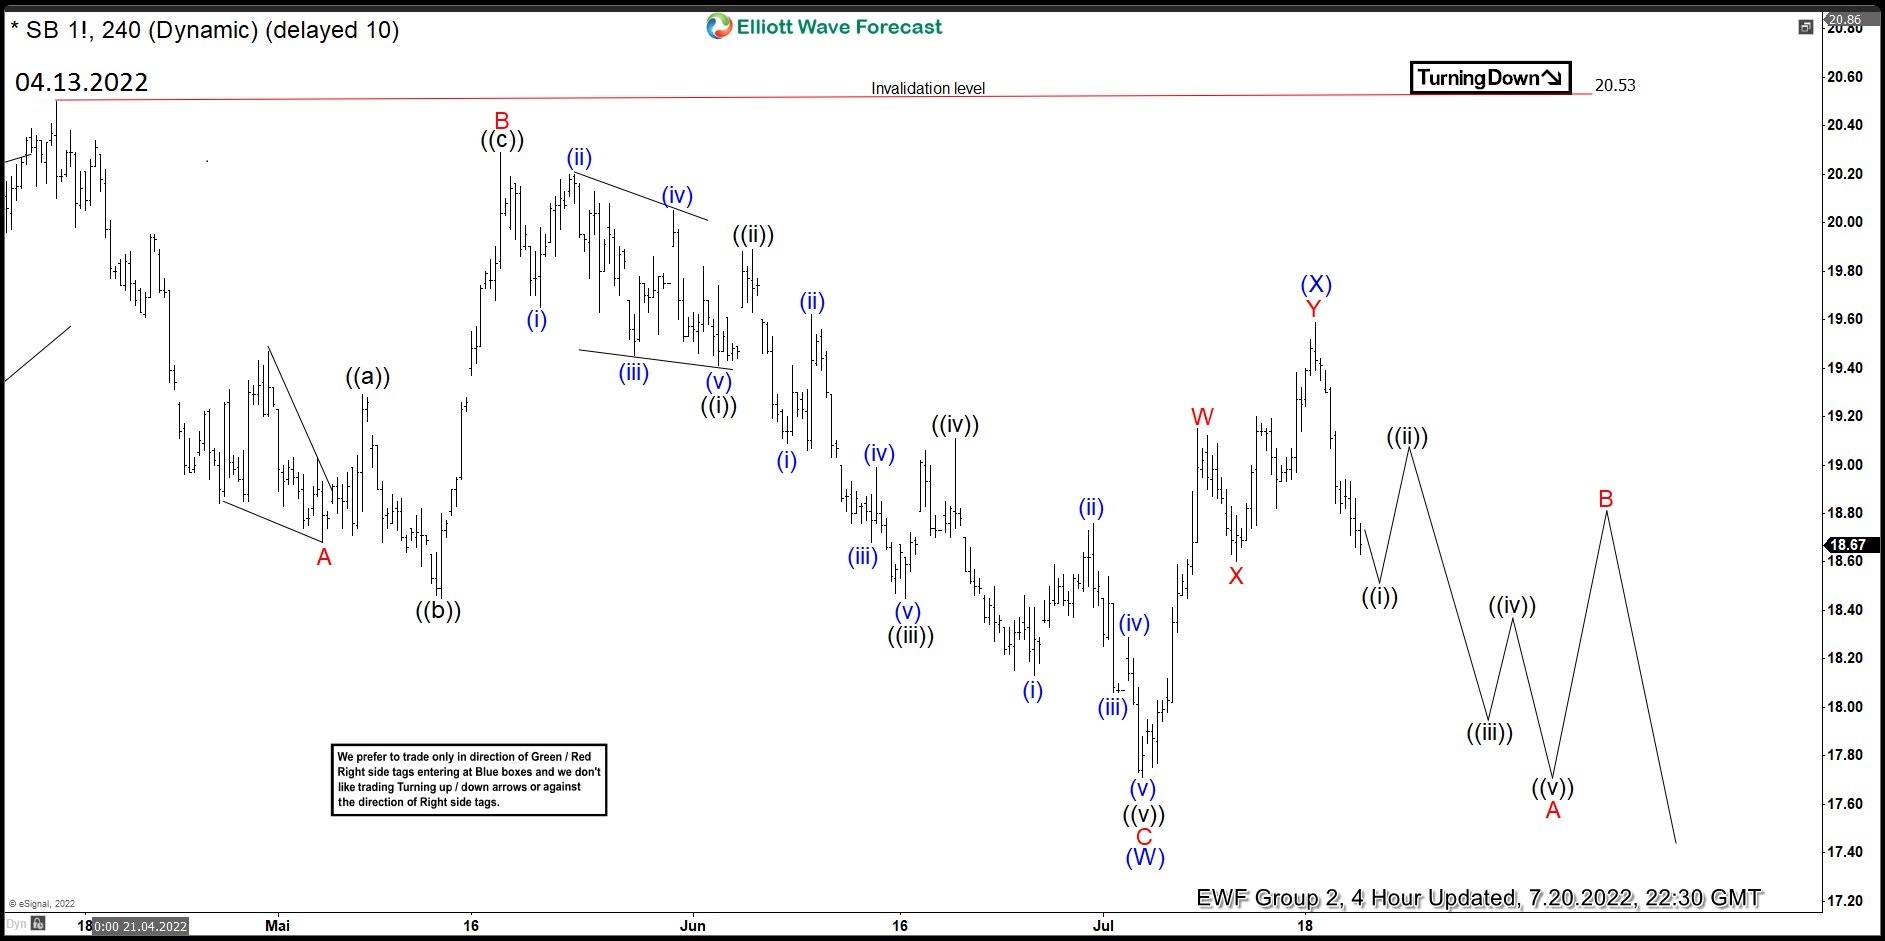
SB_F 20 July 4 Hour Elliott Wave Update