In today’s blog, we take a look at short term Elliott Wave view on Sugar (SB)
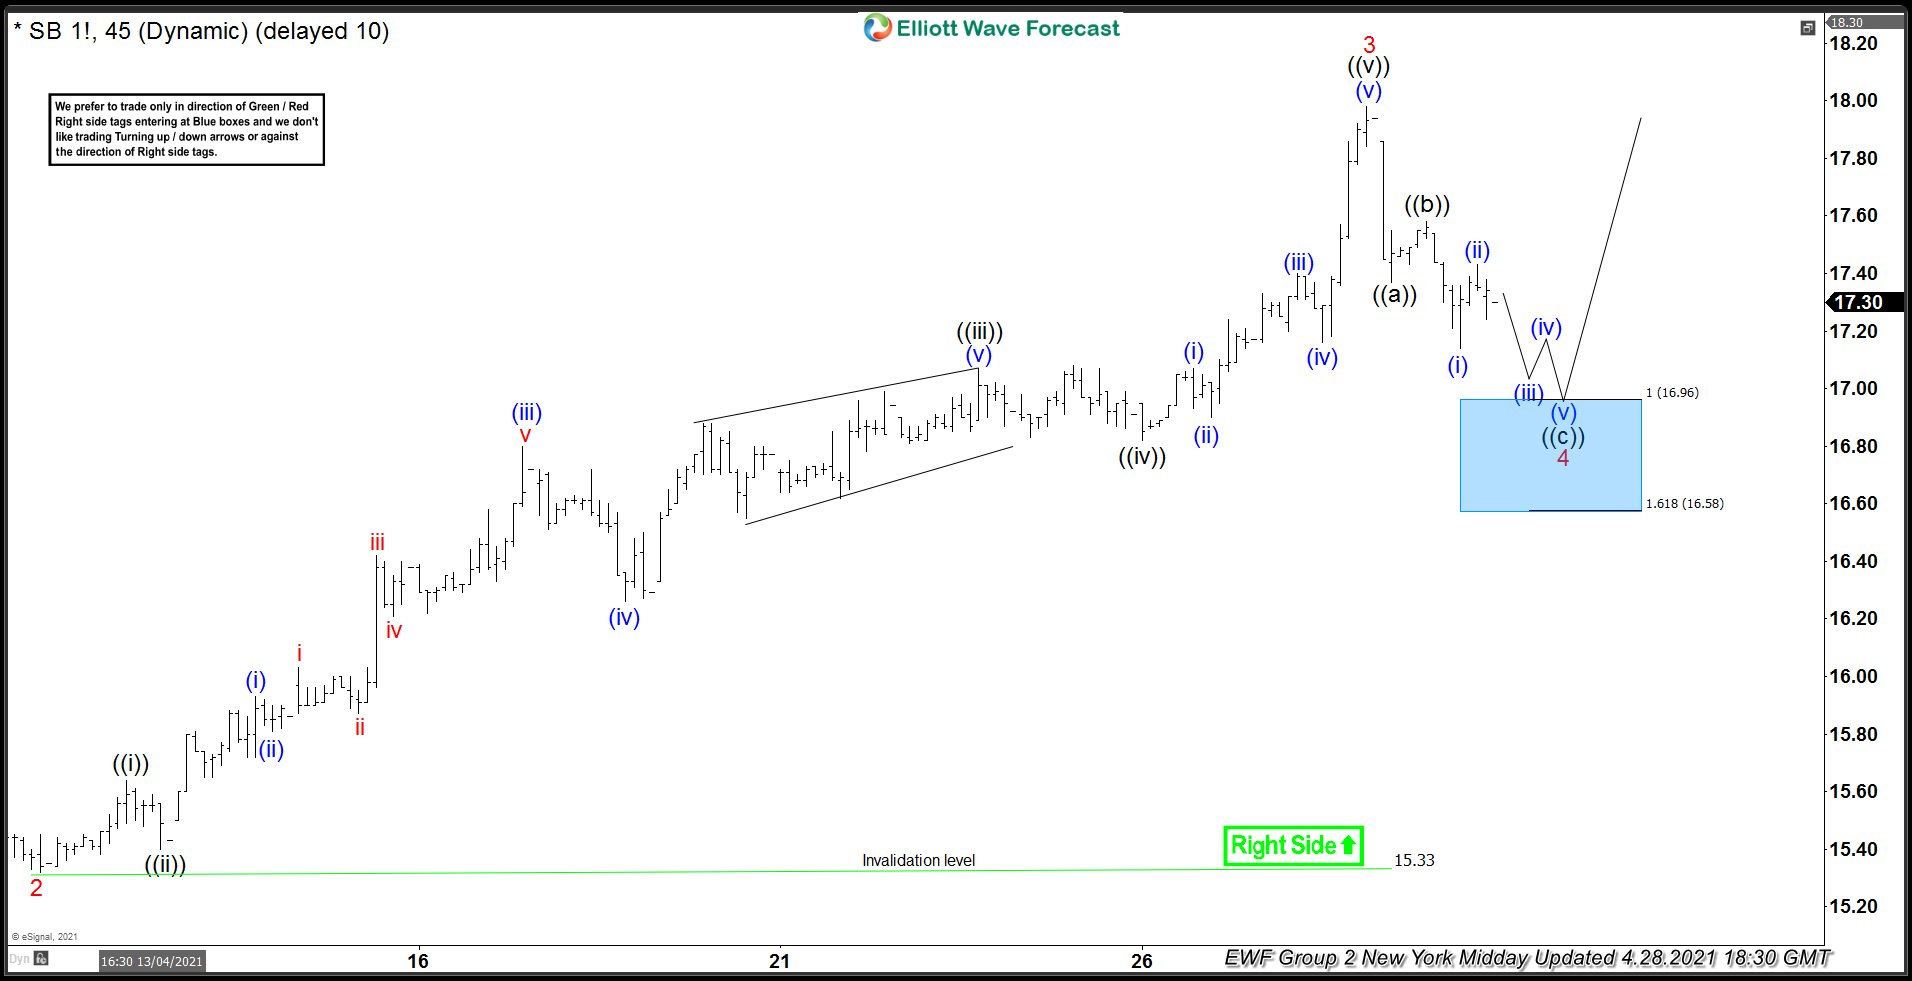
Sugar has the right side up against red wave 2 lows at $15.33. Up from there, one can see a clear Elliott Wave five wave impulse. The commodity completed the upside rally at around $17.79 area for red wave 3. Internally, we see subdivisions within red wave 3, which are also divided into five waves. We have black waves ((i)) to ((v)), each with five waves, although only shown in black waves ((iii)) and ((v)). Furthermore, waves ((iii)) and ((v)) have lower degree blue waves (i) to (v). Each of the blue waves also subdivides into lower degree red waves i to v. This is the nature of fractals.
Naturally, as per Elliott wave theory, we expected a correction lower in red wave 4. This correction is needed to correct the cycle in red wave 3, before we see upside continuation in red wave 5. Again, this is the nature of progression of market as per Elliott Wave Theory. Indeed the correction began lower in red wave 4, as shown below in the 1 hour chart from 4/28/2020 New York Midday update. As at 4/28/2021, the instrument had completed black wave ((a)) and ((b)). A completion of the aforementioned waves is important for projection of black wave (©), which would typically terminate at or within the blue box area. In this case, we expected the instrument to reach at least $16.96, and at most $16.58 in red wave 4.
Elliott Wave 1 Hour Chart 4/28/2021
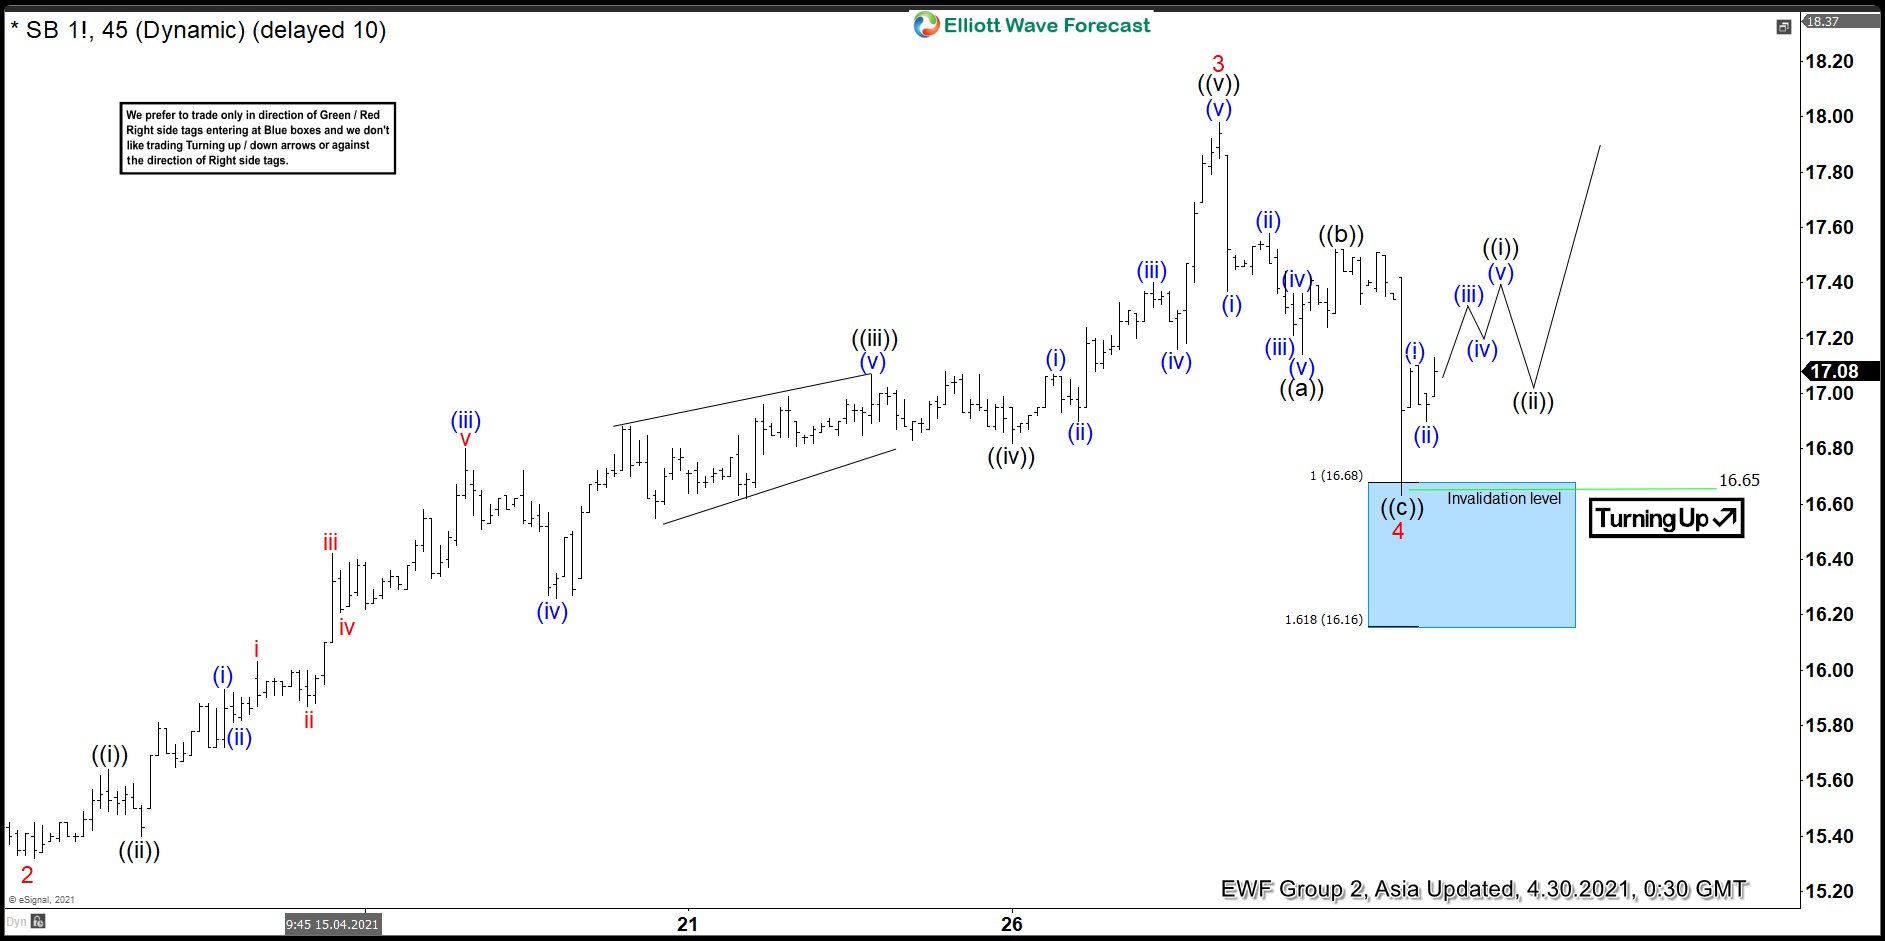
In the 1 hour chart below from 4/30/2021, we see the commodity reacting higher after reaching the blue box. It set red wave 4 at $16.64. As long as the red wave 4 lows hold, we expect Sugar trade higher. However, we need to see a clear break above re wave 3 peak in order to confirm the next leg higher. Moreover, a break above red wave 3 rules out a possibility of a double correction lower in red wave 4. Long positions from the blue box are running risk free, as Sugar is set to continue the rally
Elliott Wave 1 Hour Chart 4/30/2021
Source: Sugar (SB) Finds Buyers At Blue Box and reacts Higher

