Sugar Technical Analysis Summary
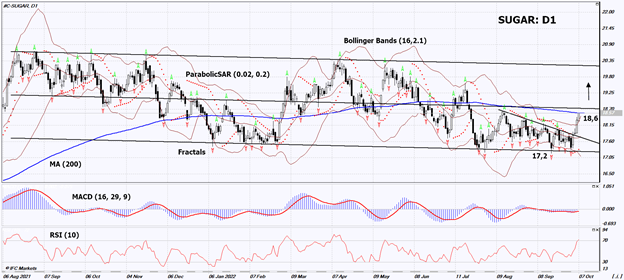
Above 18,6
Buy Stop
Below 17,2
Stop Loss
| Indicator | Signal |
|---|---|
| RSI | Neutral |
| MACD | Buy |
| MA(200) | Neutral |
| Fractals | Buy |
| Parabolic SAR | Buy |
| Bollinger Bands | Buy |
Sugar Chart Analysis
Sugar Technical Analysis
On the daily timeframe, SUGAR: D1 is moving towards the upper border of the wide neutral range. Before opening a position, it must exceed the 200-day moving average line. A number of technical analysis indicators formed signals for further growth. We do not rule out a bullish movement if SUGAR: D1 rises above the 200-day moving average and the latest high: 18.6. This level can be used as an entry point. The initial risk limit is possible below the last 4 lower fractals and the Parabolic signal: 17.2. After opening a pending order, we move the stop following the Bollinger and Parabolic signals to the next fractal low. Thus, we change the potential profit/loss ratio in our favor. The most cautious traders, after making a trade, can switch to a four-hour chart and set a stop loss, moving it in the direction of movement. If the price overcomes the stop level (17.2) without activating the order (18.6), it is recommended to delete the order: there are internal changes in the market that were not taken into account.
Fundamental Analysis of Commodities - Sugar
Brazil may increase ethanol production. Will the SUGAR quotes continue to rise?
Brazil typically converts 55% of its sugarcane crop into motor fuel (ethanol) and 45% into sugar. In the event of further growth in world oil prices, the share of ethanol may increase. At the same time, the production of Brazilian sugar will naturally decrease. Oil rises in price due to OPEC + cuts in production. The Brazilian agricultural agency Unica predicts a reduction in sugar production in the central and southern parts of the country in the 2022/2023 marketing season by 8.4% to 24.63 million tons. Recall that the United States Department of Agriculture (USDA) predicted an increase in sugar exports from Brazil in the 2022/2023 season to 28.2 million tons. This is about the same 8.4-9% more compared to the previous season. If ethanol production increases, this estimate may be revised down. Note that the share of Brazil in world sugar exports exceeds 70%. Another positive factor for sugar quotes may be the USDA forecast for a reduction in its production in the European Union in the 2022/2023 season to 16 million tons. This is 330 thousand tons less than in the 2021/2022 season. At the same time, sugar consumption in the EU is expected to reach 17 million tons.