Suhil Gold Edge

Suhil Gold Edge — Daily XAUUSD Trading Signals
Welcome to Suhil Gold Edge.
This thread is dedicated exclusively to XAUUSD (Gold) day trading.
I will share 1 to 3 high-quality Gold trading setups per day, based on a structured trading strategy and real-time market conditions.
What you can expect:

  1. 1–3 XAUUSD setups daily
  2. Clear Entry / Entry Zone
  3. Stop Loss
  4. Take Profit levels
  5. Risk-to-Reward information
  6. Market structure & liquidity analysis
  7. Trade updates and management
  8. Daily trade results and recap

The goal is quality over quantity.
I will not force trades just to provide signals. If market conditions do not offer a valid setup, there may be days with fewer signals or no trade.
All trades will be posted transparently, including losing trades.
No overtrading. No fake results. No guaranteed profits.
Our philosophy:
Trade Less. Trade Better.
This thread is currently FREE and is intended to build a transparent trading community around XAUUSD.
Risk Disclaimer: Trading financial markets involves substantial risk. These signals and analyses are provided for educational and informational purposes only and should not be considered financial advice. Always manage your own risk and do your own analysis before entering any trade.
Suhil Gold Edge
Real Gold Trading. Real-Time Setups. No Overtrading.

Wave 2: 4 Filters to Check Before Entering

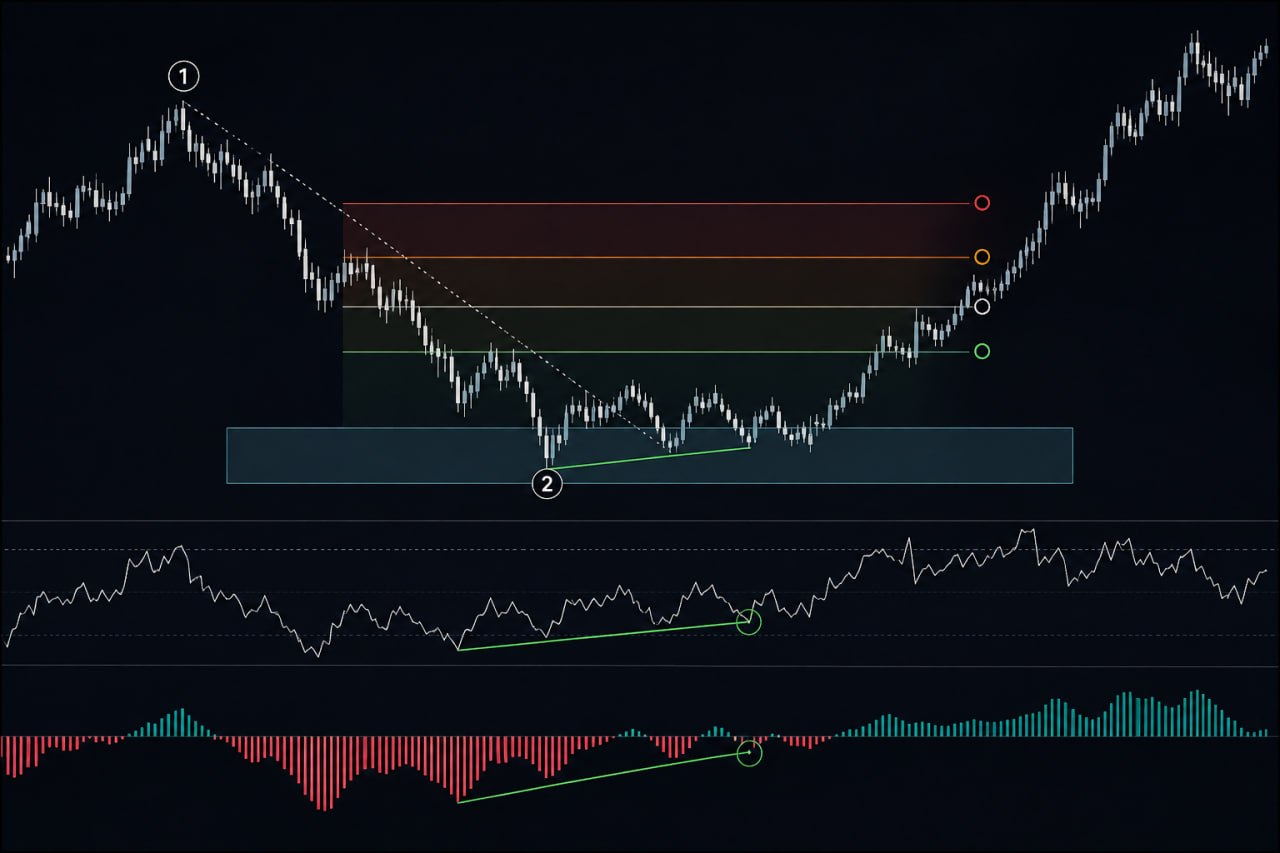
The end of Wave 2 is rarely the point that looks obvious on the chart. More often, it is where several important signals start confirming each other.

If you want to reduce early entries, consider checking these four filters:

1. Retracement Zone

Look at the 38.2%, 50%, and 61.8% Fibonacci retracement levels as potential areas of interest — not as entry signals by themselves.

2. Corrective Structure

Study the internal structure of the correction.

Is the correction still expanding, or are there signs that it may be approaching completion?

3. Momentum

When price reaches a key area, a loss of momentum in the corrective move can provide an important clue that the correction may be weakening.

4. Structural Change

:red_circle: This is the most important filter.

After price reacts from the area, wait for a clear break of the internal structure and a visible change in price behavior.

The combination of these four filters can improve the probability of identifying the end of Wave 2 and help avoid one of the most common mistakes in Elliott Wave trading:

Entering simply because price has reached a Fibonacci level.

In professional wave analysis:

Price identifies the area.
Price behavior validates the area.

Educational purposes only. Trading involves significant risk. No profit is guaranteed.

Suhil Gold Edge
Trade Less. Trade Better.

Hello Suhil Gold Edge, do you have price points we can follow? Is this applicable to current Gold price action?

Thank you!


#XAUUSD -

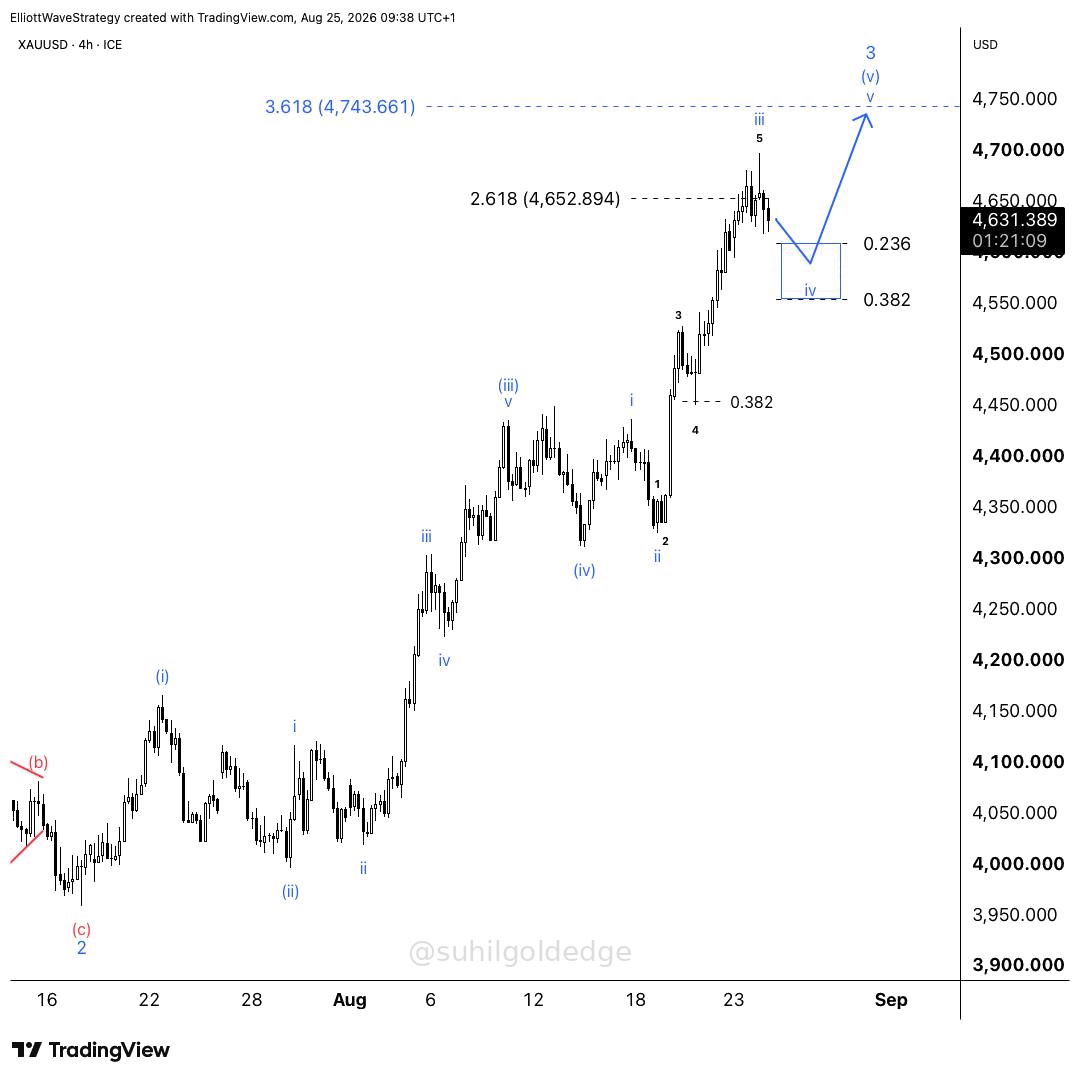
Gold’s 2nd wave was quite deep, so the 4th wave may stay more shallow.

For now, this looks more like a short pause than a major correction. The upward trend will then continue.

:loudspeaker: :dart::fire: GOLD SIGNAL UPDATE | #XAU/USD
━━━━━━━━━━━━━━━━━━━━
:zap: Status: TAKE PROFIT 1 HIT
:bar_chart: Instrument: XAU/USD (BUY_LIMIT)
:inbox_tray: Entry Level: 4640

:sparkles: Outcome:
Take Profit 1 (TP 1 @ 4650) Smashed! (+35 Pips Profit) :moneybag:

:pushpin: Trader Guidance:
:shield: MANDATORY ACTION: Secure 50% partial profits now and shift Stop Loss to Entry (4640) to lock in a 100% Risk-Free position!
━━━━━━━━━━━━━━━━━━━━
:crown: GOLD SIGNALS VIP | Pro Trading Desk

:warning: Disclaimer: All signals and trade ideas are provided for educational and analytical purposes only. Always apply strict risk and money management. Trade at your own risk.

#Gold #XAUUSD #ForexSignals #SignalUpdate #TradingResults

:loudspeaker: :shield::lock: GOLD SIGNAL UPDATE | #XAU/USD
━━━━━━━━━━━━━━━━━━━━
:zap: Status: MOVE STOP LOSS TO ENTRY (RISK-FREE)
:bar_chart: Instrument: XAU/USD (BUY_LIMIT)
:inbox_tray: Entry Level: 4640

:sparkles: Outcome:
Position is now 100% RISK-FREE! Move Stop Loss to Entry (4640).

:pushpin: Trader Guidance:
:shield: Capital is 100% protected. Zero downside risk remaining on this trade. Position remains OPEN — let remaining volume run to higher targets!
━━━━━━━━━━━━━━━━━━━━
:crown: GOLD SIGNALS VIP | Pro Trading Desk

:warning: Disclaimer: All signals and trade ideas are provided for educational and analytical purposes only. Always apply strict risk and money management. Trade at your own risk.

#Gold #XAUUSD #ForexSignals #SignalUpdate #TradingResults

:loudspeaker: :moneybag::zap: GOLD SIGNAL UPDATE | #XAU/USD
━━━━━━━━━━━━━━━━━━━━
:zap: Status: PARTIAL PROFIT SECURED
:bar_chart: Instrument: XAU/USD (BUY_LIMIT)
:inbox_tray: Entry Level: 4640

:sparkles: Outcome:
Taking Partial Profits (+100 Pips Running) :dollar:

:pushpin: Trader Guidance:
:bulb: ACTION: Close 30% - 50% of your position at current market price and move SL to Breakeven (4640).
━━━━━━━━━━━━━━━━━━━━
:crown: GOLD SIGNALS VIP | Pro Trading Desk

:warning: Disclaimer: All signals and trade ideas are provided for educational and analytical purposes only. Always apply strict risk and money management. Trade at your own risk.

#Gold #XAUUSD #ForexSignals #SignalUpdate #TradingResults

Hi! Absolutely. The analysis is based on the current Gold price action.

I’ll be posting specific price levels and trade setups whenever the market gives us a valid opportunity. The key is not to predict blindly, but to wait for price to reach an important area and then look for confirmation.

Stay tuned — I’ll keep the levels and updates posted here. :facepunch:

:bar_chart: GOLD SIGNALS TODAY RECAP (Tue, Aug 25)
━━━━━━━━━━━━━━━━━━━━
:crown: Net Profit: +100 PIPS
:dart: Win Rate: 100%
:white_check_mark: Won Trades: 1
:stop_sign: Loss Trades: 0
:shield: Breakeven: 0
:chart_with_upwards_trend: Closed Signals: 1
:star: Best Trade: +100 pips (XAU/USD (BUY_LIMIT))
━━━━━━━━━━━━━━━━━━━━
:zap: Verified by Gold Signal Publisher Pro

1 Like

That’s a solid trade! :clap:


:bar_chart: GOLD – Market Structure Breakdown (M30)

Clear price action with key ICT concepts marked:
• BSL & SSL liquidity zones
• CHOCH (trend shift)
• BOS (continuation confirmation)
• Internal liquidity (equal highs/lows)

Price has already swept liquidity and is now reacting near a key structure area.
The next move depends on whether price respects this zone or breaks it.

:bulb: Smart money leaves clues… the question is: are you reading them right?


:question: Now your turn:
Where is the best entry point on this chart?
Do you prioritize BUY :chart_with_upwards_trend: or SELL :chart_with_downwards_trend: in this setup?

:point_down: Drop your analysis below


:warning: This is not financial advice. For educational purposes only.
:calling: More setups & insights: @suhil_gold_edge (Telegram)


:bar_chart: Inflation Still Hasn’t Cooled Enough

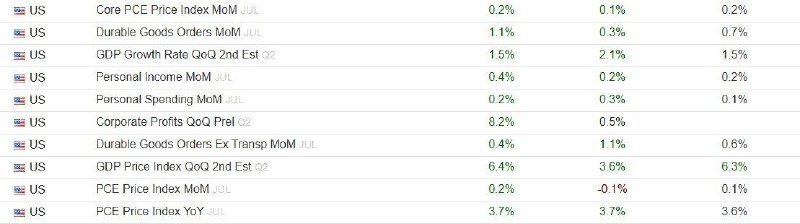
As discussed in the voice update, after the #CPI and #PPI data, the market expected the #PCE report to confirm that inflationary pressures were easing. However, that didn’t happen, and Treasury yields moved higher.

On the other hand, personal income rose by 0.4% and personal spending increased by 0.2%, with both figures coming in stronger than market expectations.

This suggests that consumer activity remains resilient, and if this trend continues, it could support economic growth in the third quarter.

:mag_right: Meanwhile, Q2 GDP growth remained unchanged at 1.5%, but the GDP Price Index was revised up from 6.3% to 6.4%, suggesting that the inflation picture in Q2 was slightly worse than previously estimated.

:writing_hand: P.S.: There was no change in #GDP, and inflation is not cooling quickly enough to make the Federal Reserve’s path completely clear yet.

@suhilgoldedge

1 Like

5800890994893983658 (1)
#GRI 41/100

:bar_chart: Today, the Geopolitical Risk Index is at a relatively low level, suggesting that Gold may be forming a potential bottom. If this scenario is confirmed, we could see a strong upward move afterward.

:yellow_circle: Buying Gold at key support levels is strongly favored, provided that price action confirms the bullish structure.
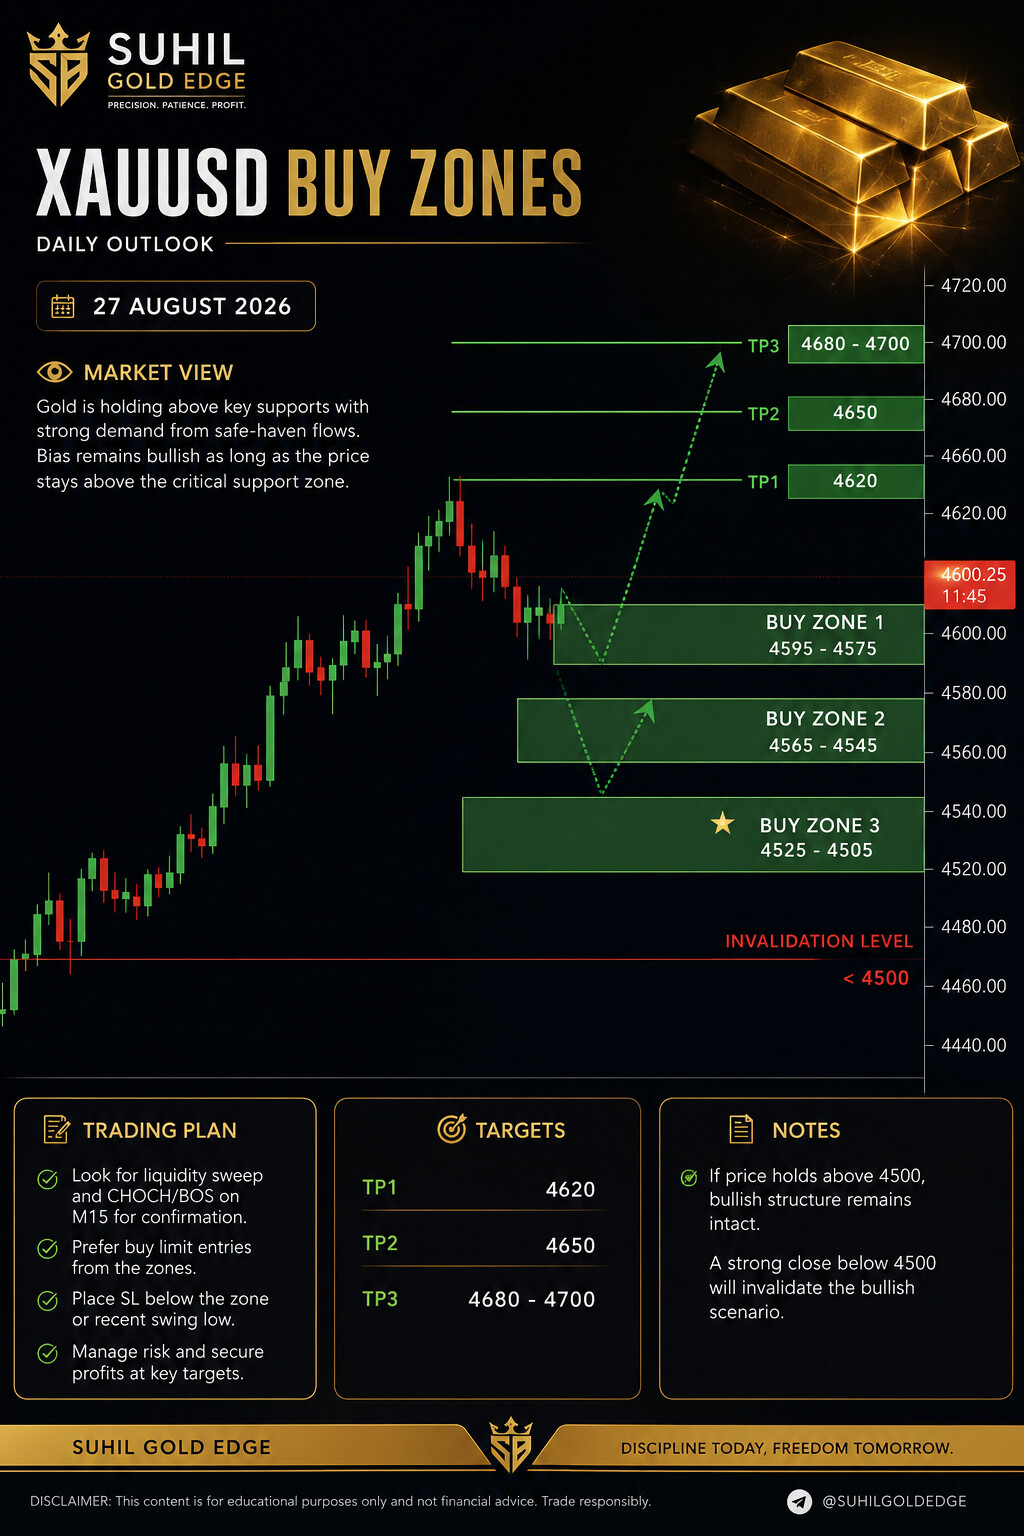
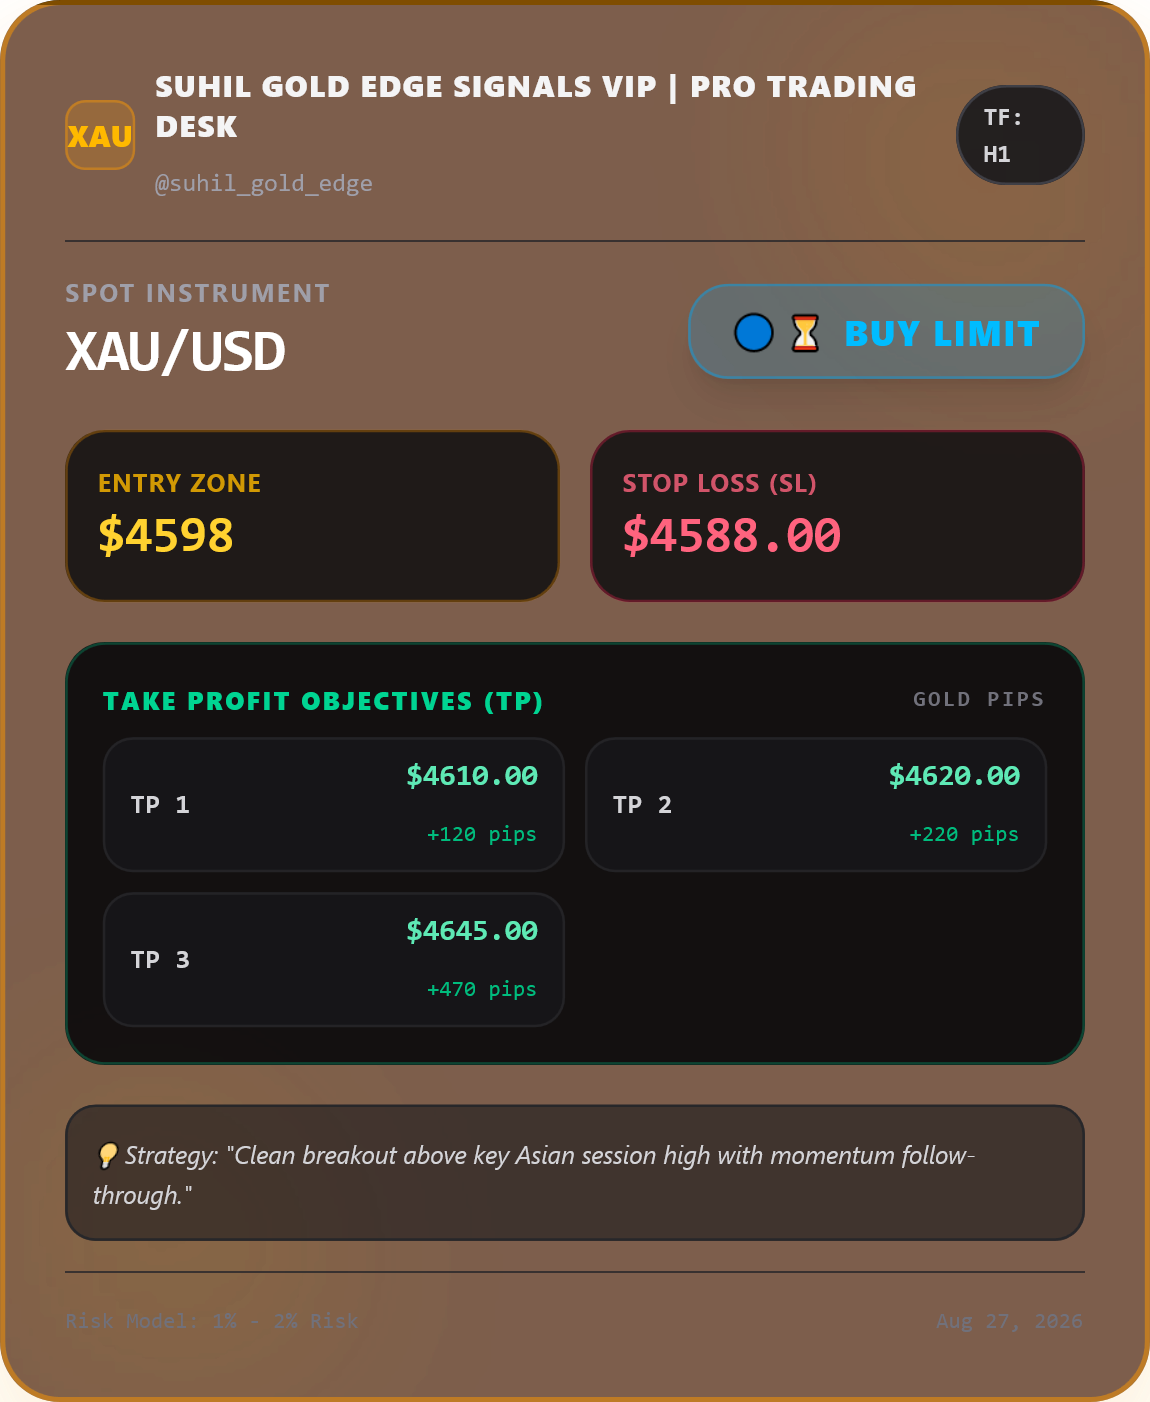
:warning: As always, risk management and proper confirmation remain essential.

@SuhilGoldEdge

1 Like


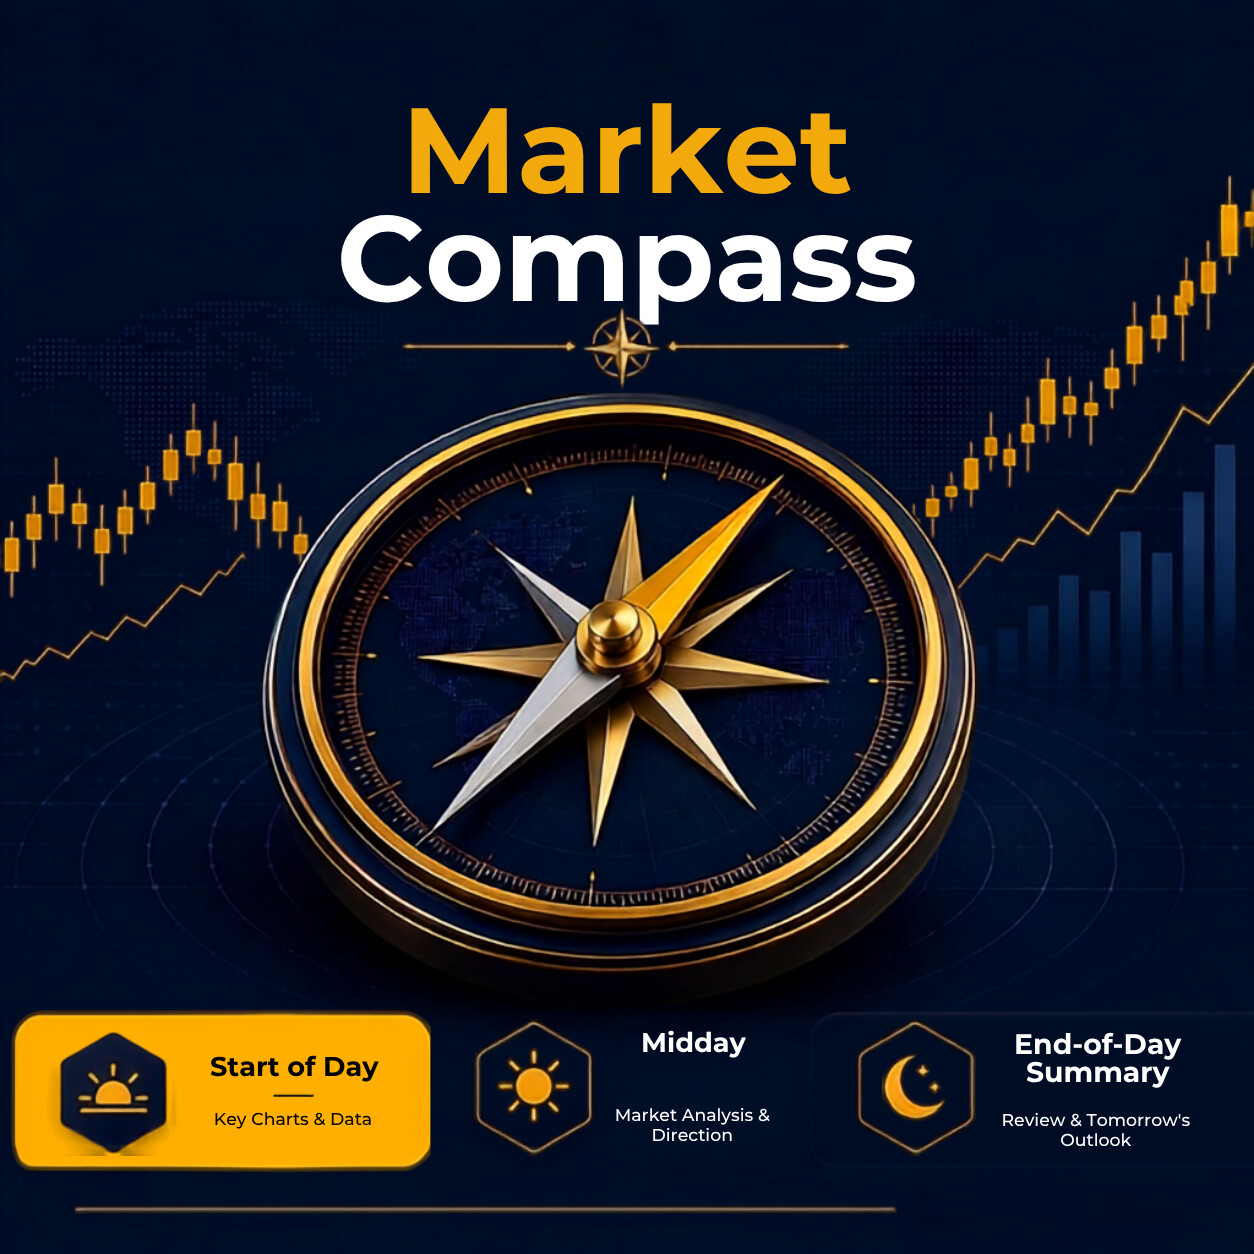
:white_check_mark: MARKET COMPASS | START OF DAY — THURSDAY, SEPTEMBER 3, 2026

Key Overnight Developments:

:small_blue_diamond: Trump signals potential end to the Iran war: Reports from The Wall Street Journal indicate that the White House is considering this option. However, the extension of U.S. troop deployments in the Middle East through 2027 suggests that geopolitical risks have not disappeared yet.

:small_blue_diamond: 40 oil tankers pass through the Strait of Hormuz: According to CNN, around 18 million barrels of oil have passed through the strait. This has somewhat eased concerns over supply disruptions, although ongoing missile and drone attacks in the region continue to support oil prices.

:small_blue_diamond: Yen strengthens as gold rises: Expectations of a more hawkish stance from the Bank of Japan, combined with declining U.S. Treasury yields, have strengthened the yen and pushed gold above $4,400.

:bar_chart: MARKET MAP:

:small_blue_diamond: Gold: Bullish :green_circle:

:small_blue_diamond: Dollar: Bearish :red_circle:

:small_blue_diamond: U.S. Equities: Bullish :green_circle:

:small_blue_diamond: Bitcoin: Bullish :green_circle:

:white_check_mark: KEY EVENTS TOMORROW:

:mega: SWITZERLAND (CHF) :switzerland:

:large_orange_diamond: 10:00(UTC+3.30) — CPI

:mega: UNITED STATES (USD) :us:

:large_orange_diamond: 16:00(UTC+3.30) — Initial Jobless Claims

:large_orange_diamond: 17:30 — ISM(UTC+3.30) Services PMI

:chart_with_upwards_trend: MARKET SENTIMENT:

:white_circle: Equity markets remain in a risk-on environment, but the rise in gold, strengthening yen, and weakness in cryptocurrencies suggest that investors remain cautious about geopolitical risks and the interest-rate outlook.

:dart: MAIN FOCUS TODAY:

:small_blue_diamond: The market is caught between two conflicting narratives: the possibility of de-escalation and the return of oil flows through the Strait of Hormuz versus continued attacks and the extension of the U.S. military presence in the Middle East.

Traders should closely monitor the reaction of oil and gold to regional developments, alongside the U.S. services data and Fed Governor Waller’s comments regarding the September rate decision.

#MarketCompass

@SUHILGOLDEDGE

U.S. Treasury Yields Near 5%: Are Markets Bracing for an Interest Rate Shock?

Financial markets are approaching a point where the main issue is no longer “inflation” in its traditional sense, but rather the cost of U.S. government financing, real interest rates, and the volume of Treasury supply becoming the primary market drivers. The U.S. 10-year yield is now around 4.8%, and testing the 5% level is no longer a distant scenario but a serious possibility.

For equities, the key issue is not just crossing 5%, but the speed of the move and how long yields remain at these levels. A gradual increase can be absorbed by the market, but a rapid rise in real rates puts pressure on equity valuations. This is especially important for growth stocks and technology companies, where a significant portion of valuation depends on future cash flows. In such conditions, even if U.S. economic growth remains strong due to AI investment, a higher discount rate can cap market P/E ratios.

From this perspective, the 5% level in U.S. 10-year Treasuries is an important psychological and technical threshold. Breaking above it could trigger a rotation from risk assets into fixed income. If this move coincides with a rise in the VIX, the probability of a deeper correction in equities increases.

In FX markets, higher U.S. rates are typically supportive of the dollar, as yield differentials versus other developed economies widen. However, an important nuance exists: if rising yields are driven by concerns over fiscal deficits and debt sustainability, the dollar may initially strengthen but later face selling pressure. Therefore, it is crucial to distinguish between yield increases driven by economic growth and those driven by government financing stress.

For gold, this environment is challenging in the short term. Higher real interest rates increase the opportunity cost of holding gold, typically creating downward pressure. If real 10-year yields move from around 2.5% toward 3%, gold could come under pressure. However, if rates rise to a point where markets interpret them as a signal of financial instability or sovereign debt risk, the dynamic shifts, and safe-haven demand could support gold again.

In such a scenario, gold may initially be hurt by higher real rates and later benefit from a loss of confidence in the bond market. This is one of the key dualities facing markets in the coming months.

For the VIX, the path of yields is critical. As long as rate increases remain gradual, the VIX may stay relatively calm. However, a rapid move above 5% in the 10-year or a push toward 5.5% in the 30-year could raise concerns over valuations, borrowing costs, and credit risk, triggering a spike in volatility.

Ultimately, the key variable for markets is not just “high rates,” but high rates combined with large fiscal deficits and heavy Treasury supply. If the 10-year reaches 5% and the 30-year hits 5.5%, markets enter a zone where the reaction of the Federal Reserve, the Treasury, and institutional investors becomes significantly more important.

The base case remains a temporary spike followed by a decline in yields. However, if markets break above these levels and sustain higher rates, the narrative shifts from a “bond market correction” to a broad repricing of all financial assets.

In this scenario, the likely sequence of market reactions could be:

Phase one:
↑ Real yields | ↑ USD | ↓ Equities | ↓ Gold (initial phase)

But if rising rates evolve into financial stress and a loss of confidence in U.S. debt:
↓ USD | ↑ Gold | ↓ Equities & Bonds → increasing pressure for policy intervention.

Therefore, the 5% level in U.S. 10-year Treasuries should be considered one of the most important fundamental parameters facing financial markets.