Here is a pic of the trades (both long trades triggered nearly right away Sunday night) as of 10AM Eastern. The yellow lines are the breakeven points, so both trades have SL set to breakeven now.
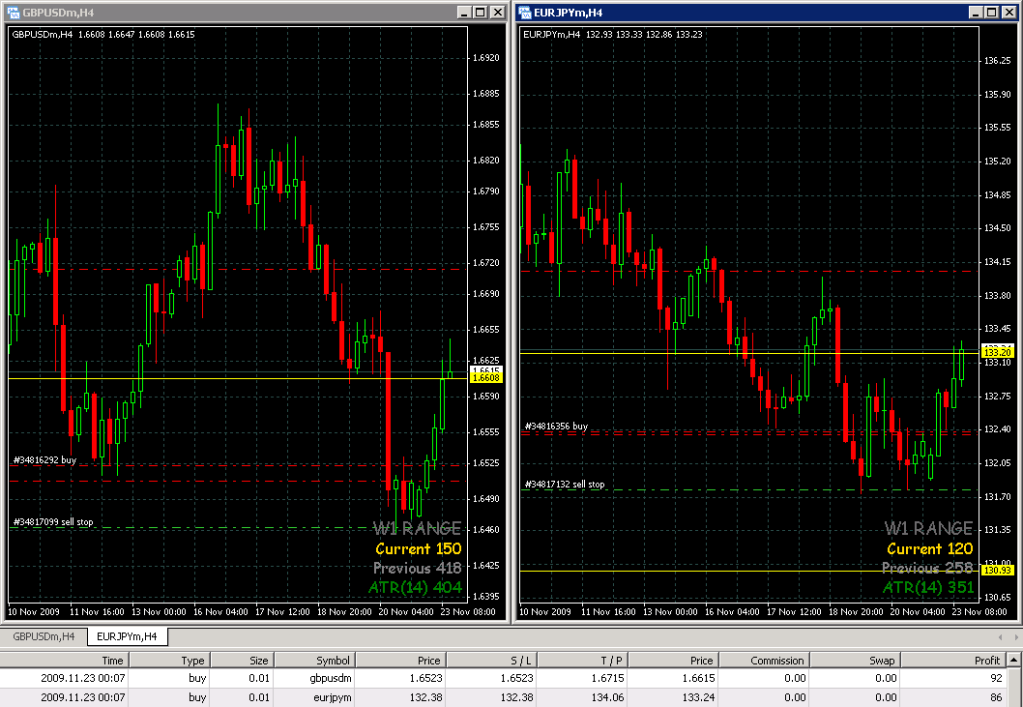
Btw, this is where I have a hard time with this system. The 4H bar has closed and its a big pinbar which indicates a reversal coming. I want to close the position in profit but I understand this is a bad idea because I’m supposed to trust the mechanical backtest. Its really hard to sit on my hands.
Just wanted to thank Dusktrader for keeping up with the numbers.
I have been out of the game for the past few weeks and it is nice to have my numbers confirmed by someone else.
Thanks again 
I am having a hard time right now since it started to go down 
I agree it is very tempting to just close out now while still in profit. Its at BE now so its no risk to us to bet it goes up. The pot odds are good, in other words, regardless of what the charts and patterns say.
BE stop hit on the GBPUSD long. My short order is still in as ATR didn’t get to 40% and it’s only Tuesday.
Unless I’m misreading something, your logic seems incorrect here. You should have moved your stop to breakeven when price moved ahead and reached 1/2 of the ATR (50%). Therefore you should no longer try to get in the short trade.
can someone please update the excel file with the actual profit? Thank you…
It can be interesting to mantain it updated…
yeah, I think you’re misreading. BE has nothing to do with the ATR and if price got to 50% of ATR that means it hit my profit target, which it didn’t.
Price has not made 40% of the ATR, which means the short order is still in
The EA has been done, and I have been using it ever since. This week’s trade on GBPUSD and EURJPY ended in BE?
Great! I posted that thinking it wasnt finished yet because of some recent posts. Il search the posts for the bot so i can test it.
I have the following numbers for this week:
[B]Sunday candle (20:00-00:00 GMT, 3pm-7pm EST):[/B]
[ul]
[li]HIGH 1.6558
[/li]
[li]LOW 1.6471
[/li][/ul]
[B]ATR/TP/BE:[/B]
[ul]
[li]ATR(14) for last week = 398 pips
[/li]
[li]TP = 398/2 = 199 pips
[/li]
[li]BE = 2(H-L+10) = 2(97) = 194 pips above LONG entry, or below SHORT entry
[/li][/ul]
[B]Entry/TP/SL/BE:[/B]
[ul]
[li]LONG Entry 1.6568, TP 1.6767, SL 1.6471, Move stop to BE @ 1.6762
[/li]
[li]SHORT Entry 1.6461, TP 1.6262, SL 1.6558, Move stop to BE @ 1.6267
[/li][/ul]
[B]Note:[/B] the move to break-even occurs just 5 pips from the TP, so you might choose to ignore the move to break-even this week.
Here are my calculations for this week:
GBPUSD
ATR = 400
trigger_high = 1.6525
trigger_low = 1.6471
BUY @ 1.6525 + 10 + sp = 1.6539
TP @ 1.6539 + 200 = 1.6739
SL @ 1.6471
breakeven @ 1.6539 + 136 = 1.6675
SELL @ 1.6471 - 10 = 1.6461
TP @ 1.6461 - 200 + sp = 1.6265
SL @ 1.6525 + sp = 1.6529
breakeven @ 1.6461 - 136 = 1.6325
EURJPY
ATR = 368
trigger_high = 130.17
trigger_low = 129.61
BUY @ 130.17 + 10 + sp = 130.31
TP @ 130.31 + 184 = 132.15
SL @ 129.61 - 10 = 129.51
breakeven @ 130.31 + 92 = 131.23
SELL @ 129.61 - 10 = 129.51
TP @ 129.51 - 184 + sp = 127.71
SL @ 130.17 + 10 + sp = 130.31
breakeven @ 129.51 - 92 = 128.59
Not sure where your candle HIGH is coming from.
[B]The GBP/USD made a high of 1.65578 (bid) at 20:55 GMT.[/B] This is within the 20:00-00:00 GMT candle.
I trade with IFBX on a live mini account. After I read your post I double checked and this is the correct high/low on my broker feed.
Dusktrader, my numbers are the same as yours, and I am also using IBFX, but demo account.
Thank you,
Albinas
Another loser on GBPUSD. My last nine trades have been either losers (7) or BE (2). The only comfort is that this sort of losing streak is well within expectations.
My testing has shown that combined losing and BE trades could occur up to 18 times in a row or you could go up to 9 weeks in a row without a win.
On average, this system wins 20% of the time. Currently this year it is at 18%.
Hey!
What do you think about third trade when first two were losers?
[B]The Sunday Breakout Strategy Revisited[/B]
Two things are killing us currently:
[ul]
[li]B[/B] Taking trades which are not justified by the Reward:Risk ratio. For a set-it-and-forget-it strategy (that is, one based entirely on entry orders with pre-determined TP’s and SL’s), Reward:Risk = TP/SL.
[/li]
And long-term success requires that (TP/SL) x (Win Ratio) > 1. This week, (TP/SL) x (Win Ratio) = 0.531.
[li]B[/B] Taking trades in ranging markets, where there is a high probability of whip-saws (like we experienced this week).
[/li][/ul]
Let’s look at these two problems in detail.
B [/B] Phil introduced the Sunday Breakout Strategy on Thursday, May 21 (post #1). The following Sunday (May 24) he posted the entry prices for LONG and SHORT trades for the GBP/USD, for the following week (post #12).
That week’s trades incorporated TP’s (LONG and SHORT) of 240 pips, based on the prior week’s ATR(14) of 480 pips.
The H-L range on the 20:00GMT 4-hour candle was 28 pips. Adding 10 pips for the entry, made the SL = 38 pips (for each leg, LONG and SHORT), which Phil rounded up to 40 pips.
For the week of May 24-29, then, the Reward:Risk ratio for each leg (LONG and SHORT) was 240:40 = 6:1
At that time, Phil said that the Win Ratio for this strategy was 30%.
A 6:1 Reward:Risk ratio corresponds to a break-even Win Ratio of 16.7%. The actual 30% Win Ratio was nearly twice that.
Conversely, a 30% Win Ratio corresponds to a break-even Reward:Risk ratio of 3.33:1. The actual Reward:Risk ratio (6:1) was
nearly twice that.
In other words, that first week, the Reward:Risk and Win Ratio numbers were good.
Fast-forward to this week.
Weekly ATR(14) for last week = 398 pips. TP = ATR/2 = 199 pips.
The H-L range was 87 pips. SL = 87+10 = 97 pips.
Reward:Risk ratio = 199:97 = 2.05:1
According to the latest post from Sean (post #1556), the current Win Ratio for this strategy is 18%.
[B]This week’s Reward:Risk ratio combined with the current Win Ratio, amounted to a losing strategy.[/B]
This week’s 2.05:1 Reward:Risk ratio corresponds to a break-even Win Ratio of 48.8%. The current 18% Win Ratio is way less than half of the break-even ratio.
Conversely, the current 18% Win Ratio corresponds to a break-even Reward:Risk ratio of 5.56:1. This week’s 2.05:1 ratio is way less than half of the break-even ratio.
[B]I think we can improve our overall results with the Sunday Breakout Strategy by avoiding trades where TP/SL < 5. [/B]
B [/B] Problem #2 is trickier. In order to identify price action that’s ranging (i.e., flat, direction-less, with no clear trend), we need an indicator. I’ve considered a couple of possible indicators, but at this point I don’t have a recommendation. I think it’s critical to choose the right time-frame for such an indicator.
What do you guys think? Does an indicator make sense, to try to filter out flat, trend-less price action?
[B]If we can tweak the Sunday Breakout Strategy so that we avoid just one losing trade every 4-6 weeks, our Win Ratio will improve, and we should become significantly more profitable overall.[/B]
I’m hoping for some suggestions from you guys.
Clint
Perhaps instead of using the H/L +10 as entry levels, we could use H/L + some percentage of the previous day’s ATR(14), and just filter out trades where the Reward/Risk ratio is insufficient, while ensuring better protection against PA ranging and bouncing off our entry levels. I have tried this with my own adaptation of this system (using the Monday 00:00GMT), and saw a tiny bit of improvement.
On that note, has anyone tested this system back more than 2 years? My system is only marginally different, yet from 2000-2007 it is consistent fail, only to suddenly become consistently profitable from then on. I would have guessed the opposite to be true IMO. Any thoughts?
Phil tested it from October 2004 - July 2009 (refer first post).
I manually tested it from 2005 to date and it hasn’t had a losing year.