Palladium market continues to be in short supply for 9 straight years. The gap between mine supply and consumption in 2020 was around 1 million ounce of palladium. The chart below shows the deficit from 2011-2019
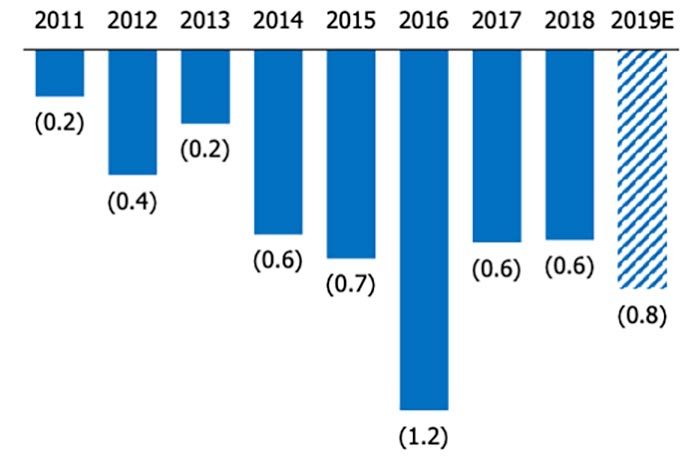
Palladium is used by automakers in catalytic converter manufacturing to clean greenhouse exhaust fumes. COVID-19 pandemic in 2020 further exacerbated the deficit as it caused the mining output to drop by 13%. While mining supply should rebound this year, limited new supply should still cause the deficit. The new Biden administration will also put focus on green energy technology, which may mean tighter regulation on car emissions. This could in turn increase the demand for the metal in catalytic converter in years to come.
Palladium (PA_F) 4 Hour Elliott Wave Chart
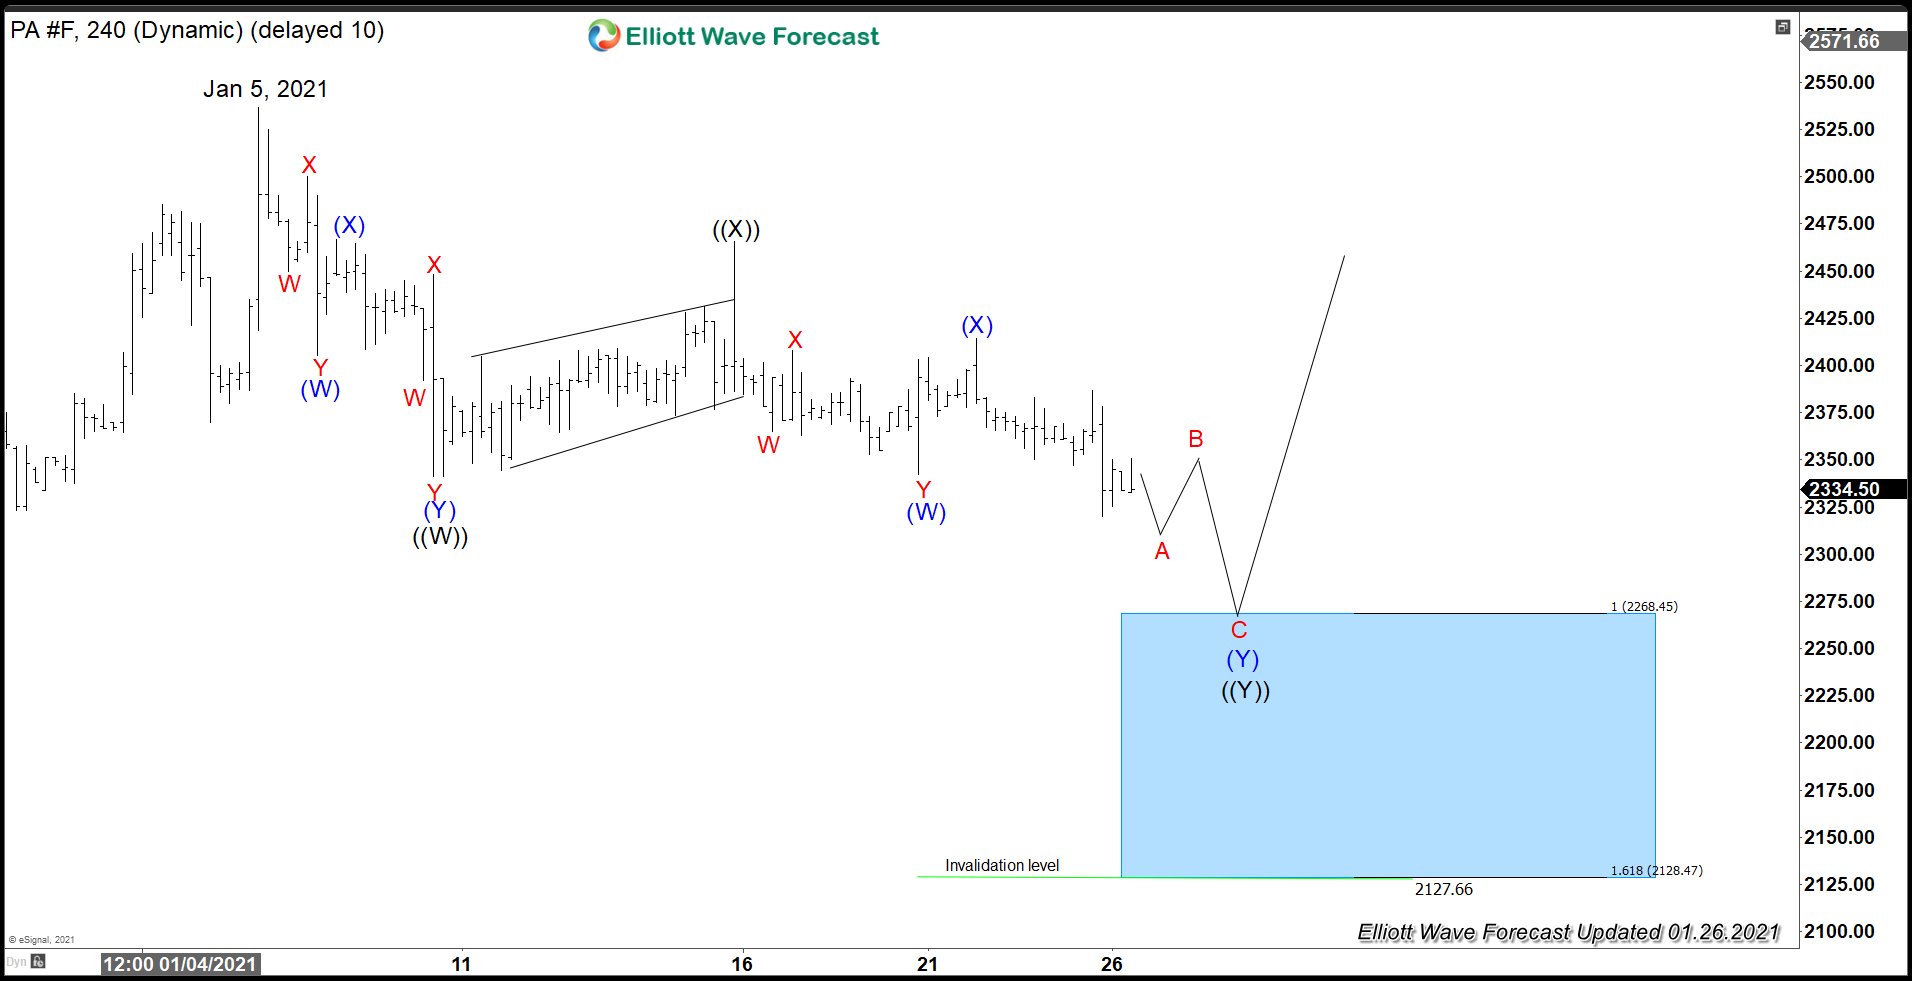
Palladium still remains in correction after forming the high on January 5, 2020 at $2536.5. Structure of the decline from there looks corrective and the internal subdivision is unfolding as a double three Elliott Wave structure. Down from January 5 high, wave ((W)) ended at $2341 with internal as another double three in lesser degree and bounce in wave ((X)) ended at $2465.5. The metal has scope to extend lower in wave ((Y)) to reach 100% - 161.8% Fibonacci extension of ((W))-((X)) towards $2127 - $2268. This area, if reached, can see buyers for 3 waves bounce reaction at least.
Source: Supply Deficit in Palladium May Continue to Support Price