i guess you should be waiting for a no demand instead…lol
I’m watching it too. But: late friday, office hours almost over. Would a signal be still valid in such a situation?
Yep, its getting a bit late, youve all probably noticed that there is a bit of supply coming in now. Looking forward to monday.
…and French, US, Canada holiday. Having said that…it’s heating up lol. If I see a setup, I may take it with very small risk.
Nope, I’m outa here. See ya next week. 
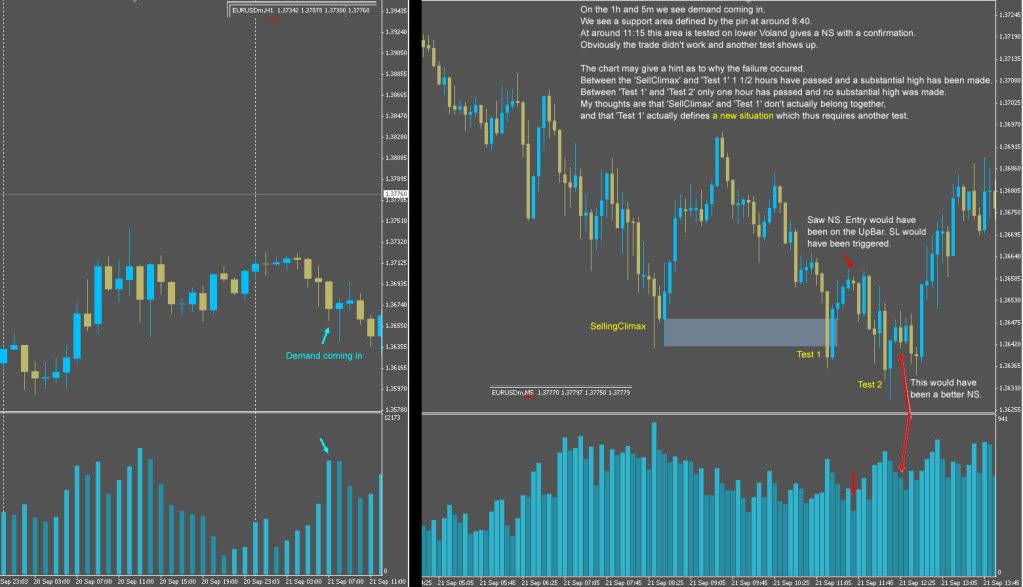
Hey guys. Looking through the old thread and charts I found a reoccuring spot that I have some trouble with.
Basically it’s a spot where price forms a low with demand coming in and then we’re looking for a test, but the test seems a bit far away from the climax and inbetween price has made a rather high peak. And so I’m not quite sure if the climax and test actually belong together or whether instead the test actually defines a new situation independent of the climax; ‘independent’ means that the test requires another test before a safe NS.
Are there some general guidelines that define a climax and test belonging together, rather than the apparent test actually forming a new situation?
I hope you know what I mean, it’s a bit difficult to articulate.
You seem to be unclear about your N.S. and N.D., the N.S. you have marked on the chart are N.D.
You find N.S. on a trough and then you continue the trend long, N.D. you find on peaks and continue the trend short.
Hm, I’m confused now. The way I understand NS is that after demand comes in and after the low is tested we look for downbars with very low relative volume. Then after an UpBar closes above this NS-bar we enter long.
In my chart: The first NS appears as price is moving away from the lowest point and the NS DownBar shows the lowest volume of the past 20 bars. The second NS is also a DownBar which appears after price moves away from the low and it shows the lowest volume of the past 5 bars. This tells me that supply is exhausted and a markup will take place without hindrance.
After NS bar, there is a down bar. Wait for an Up Bar to confirm there is no supply.
1 Like
DISSECTING A FOREX CHART USING VSA METHODOLOGY.NO INDICATORS NECESSARY…TRADING BLIND
DISSECTING A FOREX CHART USING VSA METHODOLOGY, NO INDICATORS NECESSARY
it would be better to use ohlc bars so you can decipher the bars.
you trade larger time frames if you consider yourself a position trader, or you can trader lower time frames.however your best bet is to be able to use multiple time frames so you can have an understanding whats going on with the pair on a macro or intraday action
im sure if you drilled down on 15m/5m you could taken a long position off that stopping volume if you had some accompanying tests bars on the lower charts.Based on the results after that stopping volume there was massive pent up demand.
You are correct, they are no supply bars, not no demand. No demand are up bars, no supply are down bars. But yes, wait for confirmation on the next bar to validate that it was a no supply.
It’s more than just about individual bars, you have to take the rest of the story into account, where the pin bars are is more important than if they are up or down bars.
I think you have to look at higher lows/lower highs to consider the entry. A single NS or ND bar can not provide you an entry. That would be too easy.
You did not marked test 3 what is a succesfull test because that one was on low volume. Test with low volume signals that the test was succesfull. Also if you draw a trend line, it shows you nicely the false entry points. Sometimes I think, smart money knows that more and more people use vsa so they try to make the market to provide false entries for the incautious.
Ok I’m not sure I’m answering the right question, but I think this graphic will illustrate an importantish point, i.e. that both sets of candles are in effect telling the same thing yes?

Yes, they are the same.

Japanese Candlestick charting Techniques by Steve Nison, page 56
Cool, so now we are are all clear that it’s not the actual bar that tells the story, it’s where it’s at that needs to be established, this is why the Volume indicators like Better Volume and the like are just no good.