Sorry, had a few issues with getting the charts on. They are there now 
Tassie, I know that it technically was not a ND (right?), but otherwise it seemed to be a push-through move, as indicated on my chart.
I got hosed this morning taking the short on the no demand, after the 10:10 mark on my chart below, right before that push upwards.
Is there any way I could have seen that coming? Or did anyone else make the same mistake?
It was an actual ND, the trade I think was technically correct, but it’s a kind of a stand alone setup, it’s got nothing else to back it up, so not very high probability for the longer trade at least, you could have snatched a few pips, or take BE.
I don’t really think the market is back to normal yet. I was also expecting a short today but that didn’t really happen…
Although, your trade could be a good example of what might happen if you don’t wait for a bearish close on the 1Hr before entering a trade. Just a heads up 
Found a small issue with the NDNSHistory, if you had an ND/NS straight after each other it would cancel one out!
NSNDHistory.zip (1.85 KB)
On my hypothetical trade earlier, it met good resistance at the 5 min 50-61.8 fib level. When it hit that level initially, as I said, I would have locked in BE and taken half the trade, so it would have stopped out on BE but I would have taken half a position on about 17 pips, which would have been a bit less than a 1% profit. Better than nothing anyway.
I did say that I wasn’t taking the trade as I wasn’t too sure of the behaviour of the market yet since it was so early in the new year, but would have been a small profit to start the year off.

Hey Luiz…and everyone. I’ve enjoyed all the free time, but glad to be back to the routine now. 2012, bring it.
What do the different colours of the arrowheads mean? Different classcification of NS or ND? Also does the indicator alert you of new ND or NS as soon as candle close (or for confirmation next candle after close?)
Hey Pete.
As I’m going through your first thread, I’ve been compiling important posts by you and other knowledable posters as a reference. When (and if lol) I do finish compiling it (along with this thread)…it might help some people. What do you think?
Sounds great. (I can’t vouch for the accuracy of information posted by others though)
So far it’s mostly your posts with a few from purple, nerokoso, enpoint and procrast so far. It’s really the graphs and the corresponding explanation which I hold in high regard.
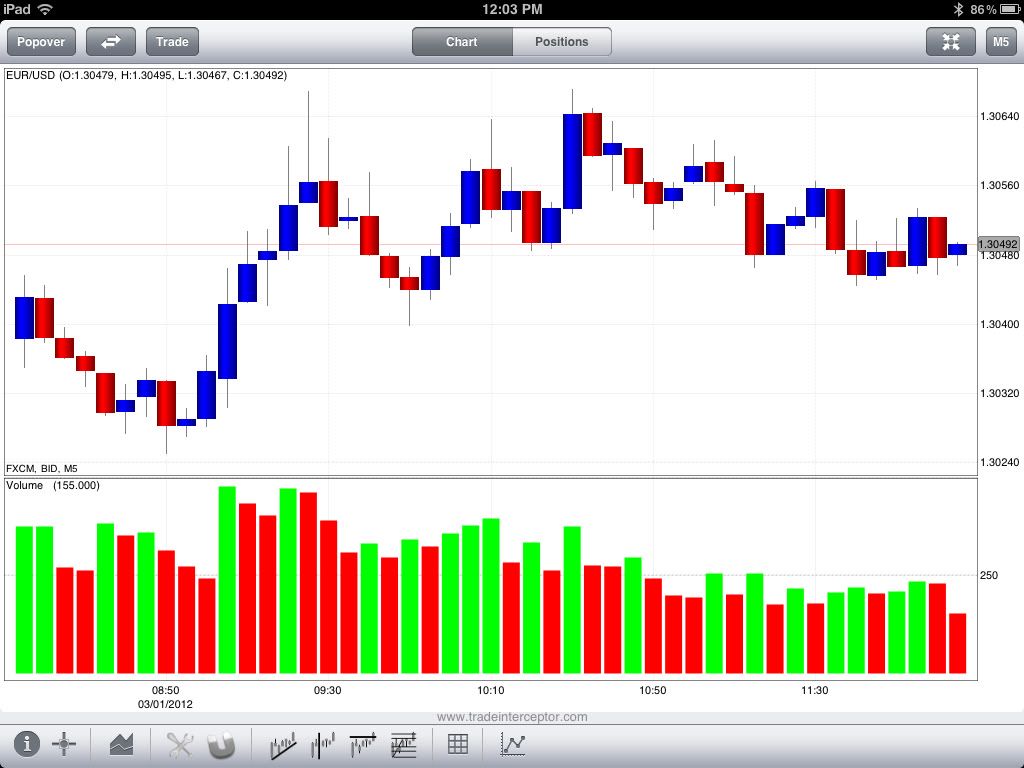
Unrelated but FXCM tick volume is truly terrible.
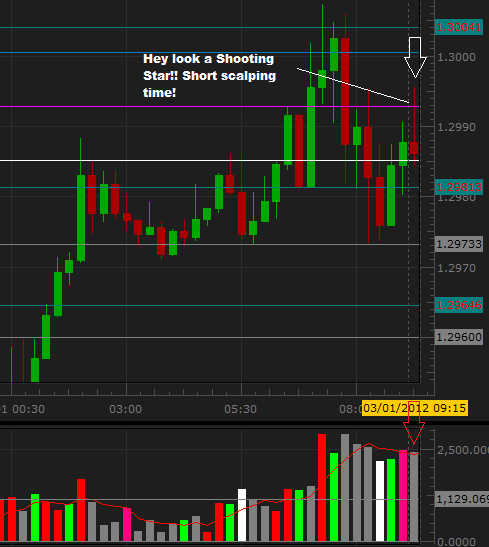
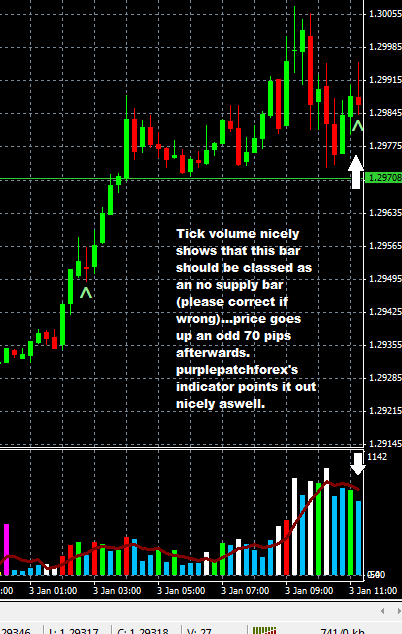
This bar occured yesterday at 9:15 GMT. First chart is FXCM and second is Go Trader.
Did you short off of a no supply? Of course the price went up, because there is a lack of supply (sellers). It’s not odd that the price went up 70 pips, it was supposed to especially with the abundance of signs of strength in the background.
no supply = long entry after next candle close above high of no supply with signs of strength in the background
no demand = short entry after next candle close below the low of no demand with signs of weakness in the background
Sorry I didnt make myself clear. I didn’t take the trade and my words in the first pic were supposed to be sarcastic ;).
My aim in that post was to compare FXCM tick volume with a usually reliable Go Trader tick volume.
In the first pic the volume for the shooting star candle is higher than the bar 2 candles to the left…so if you were using FXCM you wouldnt have traded the legitimate no supply or maybe even traded incorrectly due to a crappy feed. Go trader on the other hand shows the volume for that shooting star correctly (volume below previous 2 bars) and would have induced me to go long after [I]confirmation[/I].
Just use IBFX MT4 volume feed. Keeps everybody on the same page in this thread.
Hey Guys,
In demo learning VSA. Took this scalp today during Asian trading on AUDUSD. Any comments appreciated?

P.S. this is officially my first VSA trade…
I also use it. Handy to have several feeds to compare I feel.
You might want to check out this posting.
The lighter darker coloured NS has a larger bottom wick and ND VV.
I think it was clear, I think traderjoo made the same mistake I as I do now and again, you read someone else’s chart and make assumptions.
It does seem that FXCM is not a good tick volume to use, BUT you may also find that on the whole it might work just as well, I looked into a lot of different ones last year, and there are swings and roundabouts, but on the whole they give very similar results, but yes, it’s better is we stick to the same one for the purpose of this thread and this strategy.
Looks like you are on the right track, but for learning purposes it’s better to stick to EURUSD, you will get better critique and help.