Hey all, wanted to share something that trips up a lot of newer traders, myself included back when I started. Treating support and resistance as exact lines when they are really zones, and treating moving averages like a totally separate tool from that idea when they usually overlap.
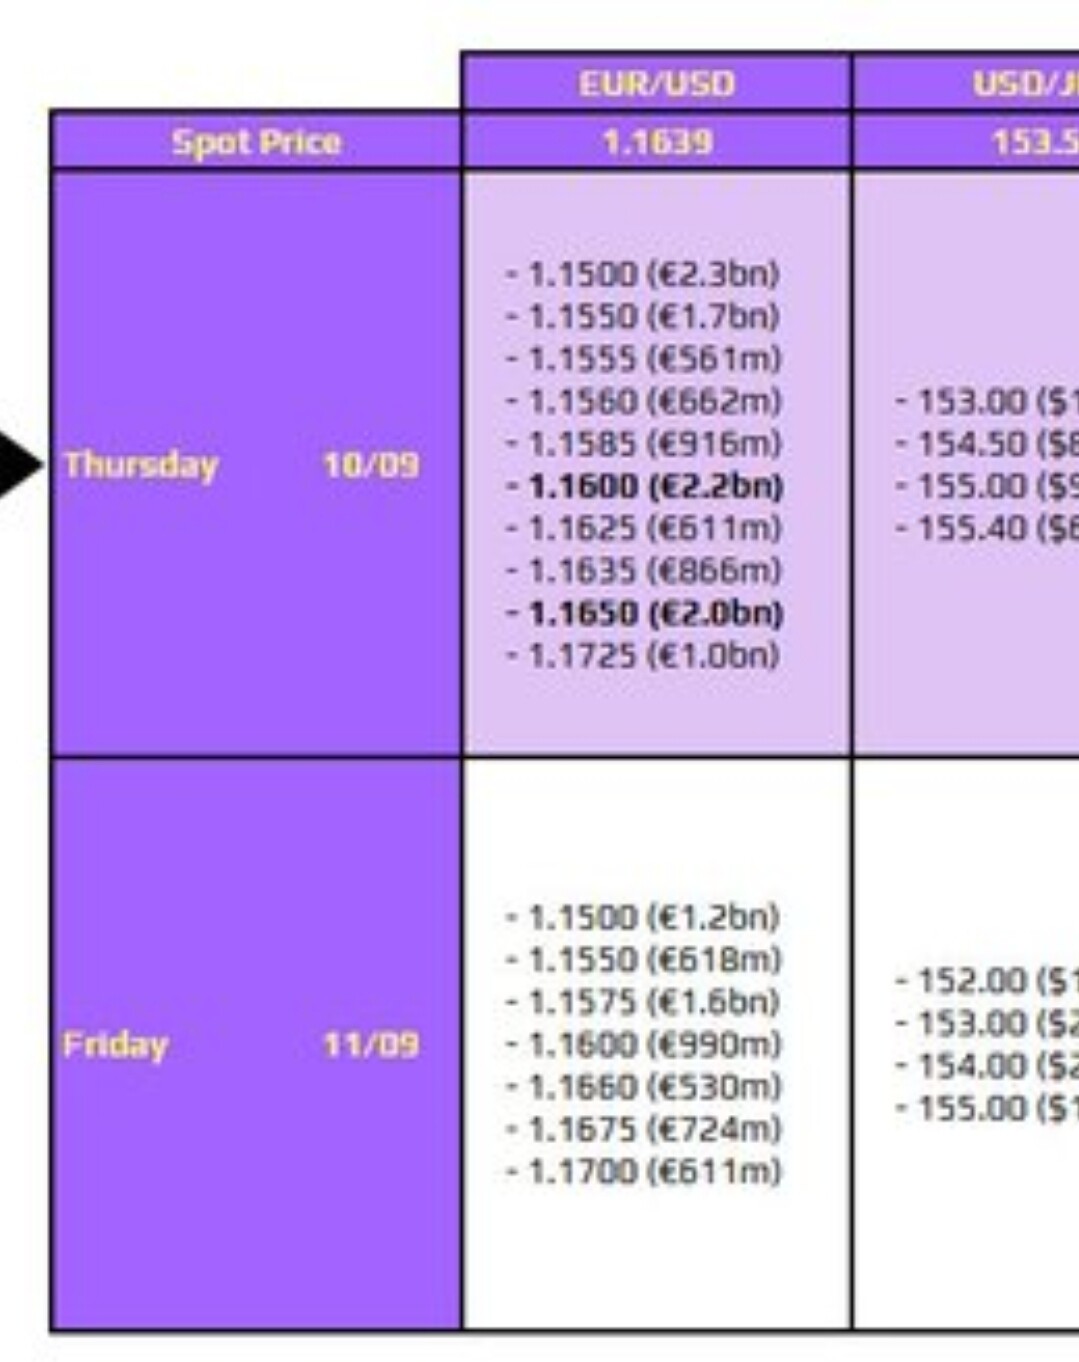
EUR/USD is a good live example right now. Pair is around 1.1623, sitting just above its 20 day EMA near 1.1600. That EMA is not just a trend line here, it is acting like dynamic support because enough people are watching it and reacting when price touches it. Above that, 1.1650 has capped a few rallies already, so that is your resistance in the classic sense.
The mistake I see all the time is drawing support at the exact low of one candle wick and expecting a perfect bounce every single time. Markets just do not work with that kind of precision. Think in zones instead, something like 1.1590 to 1.1610 rather than exactly 1.1600, and treat a break of the whole zone as your real signal, not one quick wick through it.
Stack an EMA with a horizontal level and you have got more to work with than either alone. That is really all confluence means, a few independent reasons all pointing at the same spot. Hope that helps someone starting out.