Do I draw in trend lines first to find support and resistance
Trendlines are dynamic support and resistance.
Trendlines are defined by angled line, towards UP for Uptrend and DOWN for Downtrend.
Support and resistance line are horizontal lines that marks swing high or swing low or high and lows in a trend.
So answer to your question the trendlines are not clean support and resistance but dynamiy support and resistance.
1 Like
If you’re talking about angular trend lines, my experience has been that they are entirely meaningless. I would not bother with them.
I disagree that trend lines are meaningless. Trend lines can help determine what area price could bounce off while on its way up to a resistance level, or down to a support level. Depends on your trading strategy, you can use trend lines to draw out chart patterns.
2 Likes
What do you use instead?
I determine trends visually. I also use other price action constructs such as support resistance, areas of congestion, velocity etc to determine entries and exits. Essentially, I’m a velocity trader who trades with a higher timeframe trend.
1 Like
I start with the horizontal line first then the trend line! According to me; horizontal lines are more powerful!
1 Like
I personally don’t care for trend lines at all. Which ones hold? Which ones fail? Which ones are completely ignored by price?
For me I have much more faith in horizontal lines. For S/R lines try to drag your line to a spot with the most amounts of touches and put more weight into candle bodies over wicks.
it’s highly subjective (support and resistance that is) so it is as much art as it is science. Over time you develop more confidence when you see price react at your levels on your chart.
1 Like
Trendlines are very useful. They give you an idea as to which direction the market is likely to go.
Hi all,
continuing this tread instead of starting a new one.
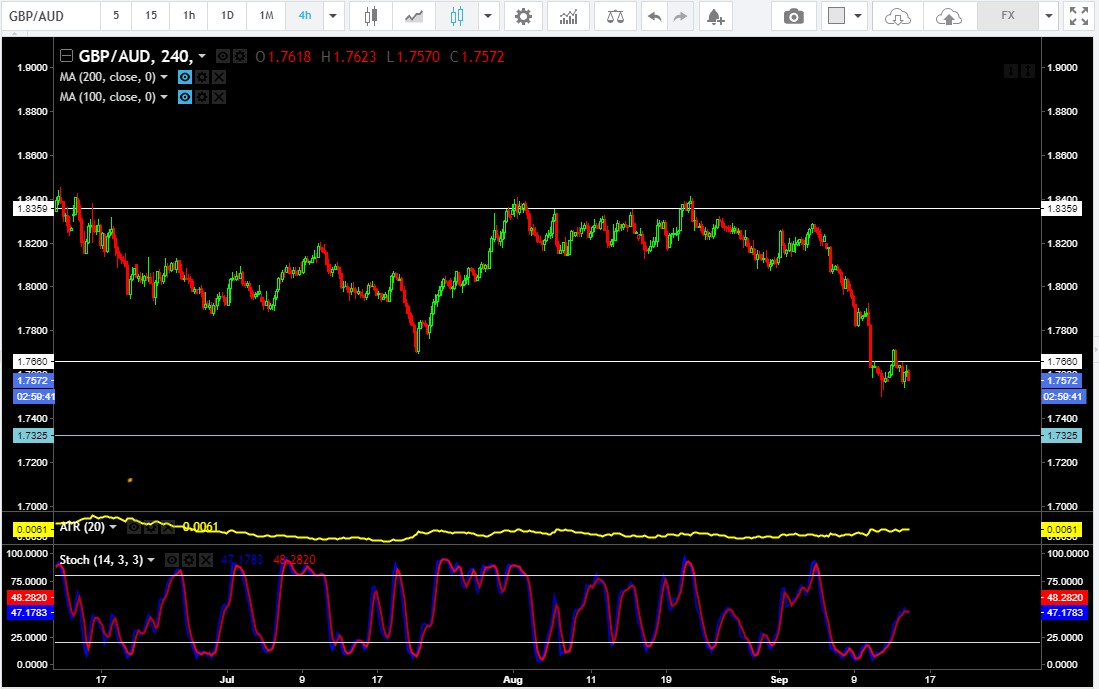
When drawing Support and Resistance lines, how far back to you look on your chart? Are support and resistance that are over a year relevant? I am focusing on daily and 4 hours. Below is a dally chart for GBP/AUD, trying find a good entry point at this support or the the one below at 1.7325.
with a ATR of 157, my stop would be right in the middle of the two channels. i would get pair keeps dropping, I would stopped. If i were to enter, at this point, what kind of candle should i be looking to go long