TecDAX is a stock index which tracks the performance of 30 largest German companies from the technology sector. Even though these enterprises are of a high economic importance, their market capitalization and the book order turnover are far below of that of the DAX index. The TecDAX is related to DAX in a similar way like NASDAQ is related to Dow Jones Industrial Average index.
From technical perspective, NASDAQ has been the strongest index in the US. As a matter of fact, it has provided high rewards for those traders who were buying the dips for more upside. One of the features of the market behavior is that weak indices remain weak and strong indices remain strong. The fact that NASDAQ has been outpacing other US indices makes it a good candidate to buy it again once the indices turn higher again. Similar strong uptrend can be also seen in a behavior of TecDAX. This index, therefore, allows entering the German technology sector by providing investors and traders with high returns and protecting them, at the same time, from the defaults originating from trading of single stocks.
Last year, we have presented in the initial article an expectation for more upside in the TecDAX. We were right, the rally has happened as anticipated. Here, we will present an update.
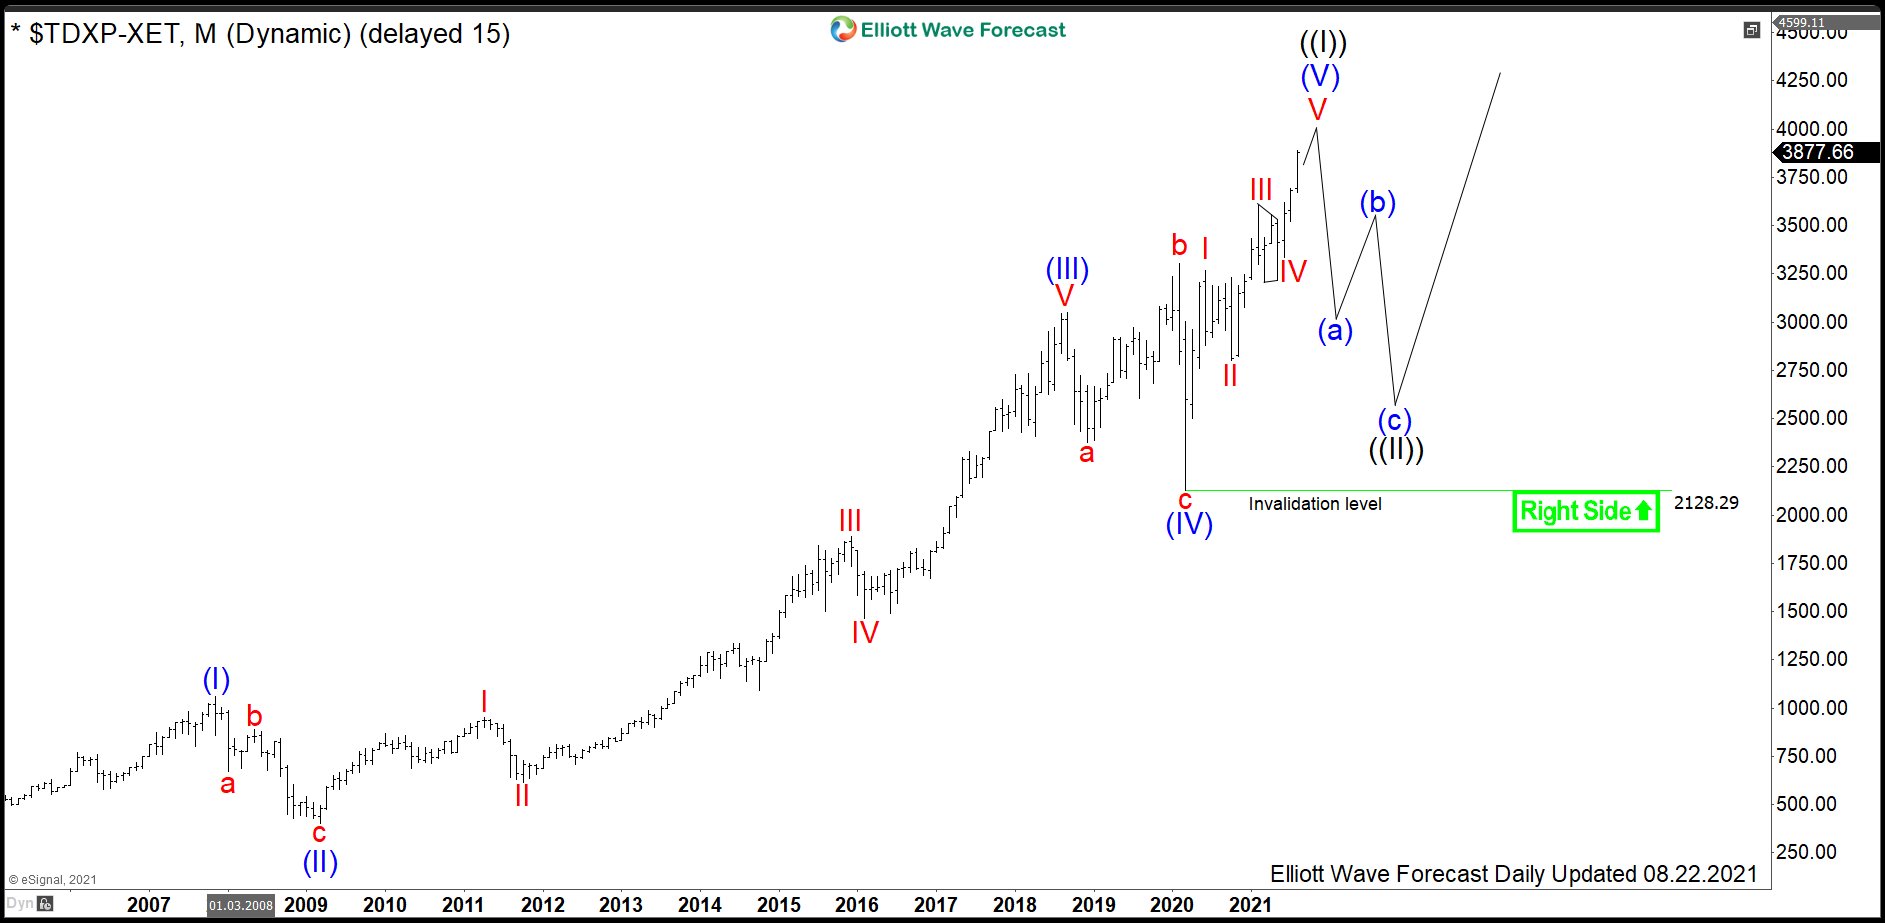
TecDAX Monthly Elliott Wave Analysis 08.23.2021
The monthly chart below shows the TecDAX index $TDXP listed at Frankfurt Stock Exchange. From the all-time lows, the index price has developed a cycle higher in wave (I) of a super cycle degree. It has ended in November 2007 at 1060.35. From there, a correction lower in wave (II) has retraced part of the rise by printing a bottom in March 2009 at 387.50.
In 2013, TecDAX was able to make a higher high opening up a bullish sequence. As a matter of fact, it has extended from March 2009 lows far beyond 1.618. Therefore, the cycle higher is an impulse in blue wave (III). It has reached 3051.44 highs in September 2018. From the top, a correction lower has unfolded as an expanded flat which has found its bottom in March 2020 at 2127.05. From march 2020 lows, a cycle higher in blue wave (V) has started and might be already in the final stages.
Once wave (V) of the cycle in black wave ((I)) will end, a correction in wave ((II)) against the all-time lows should follow.
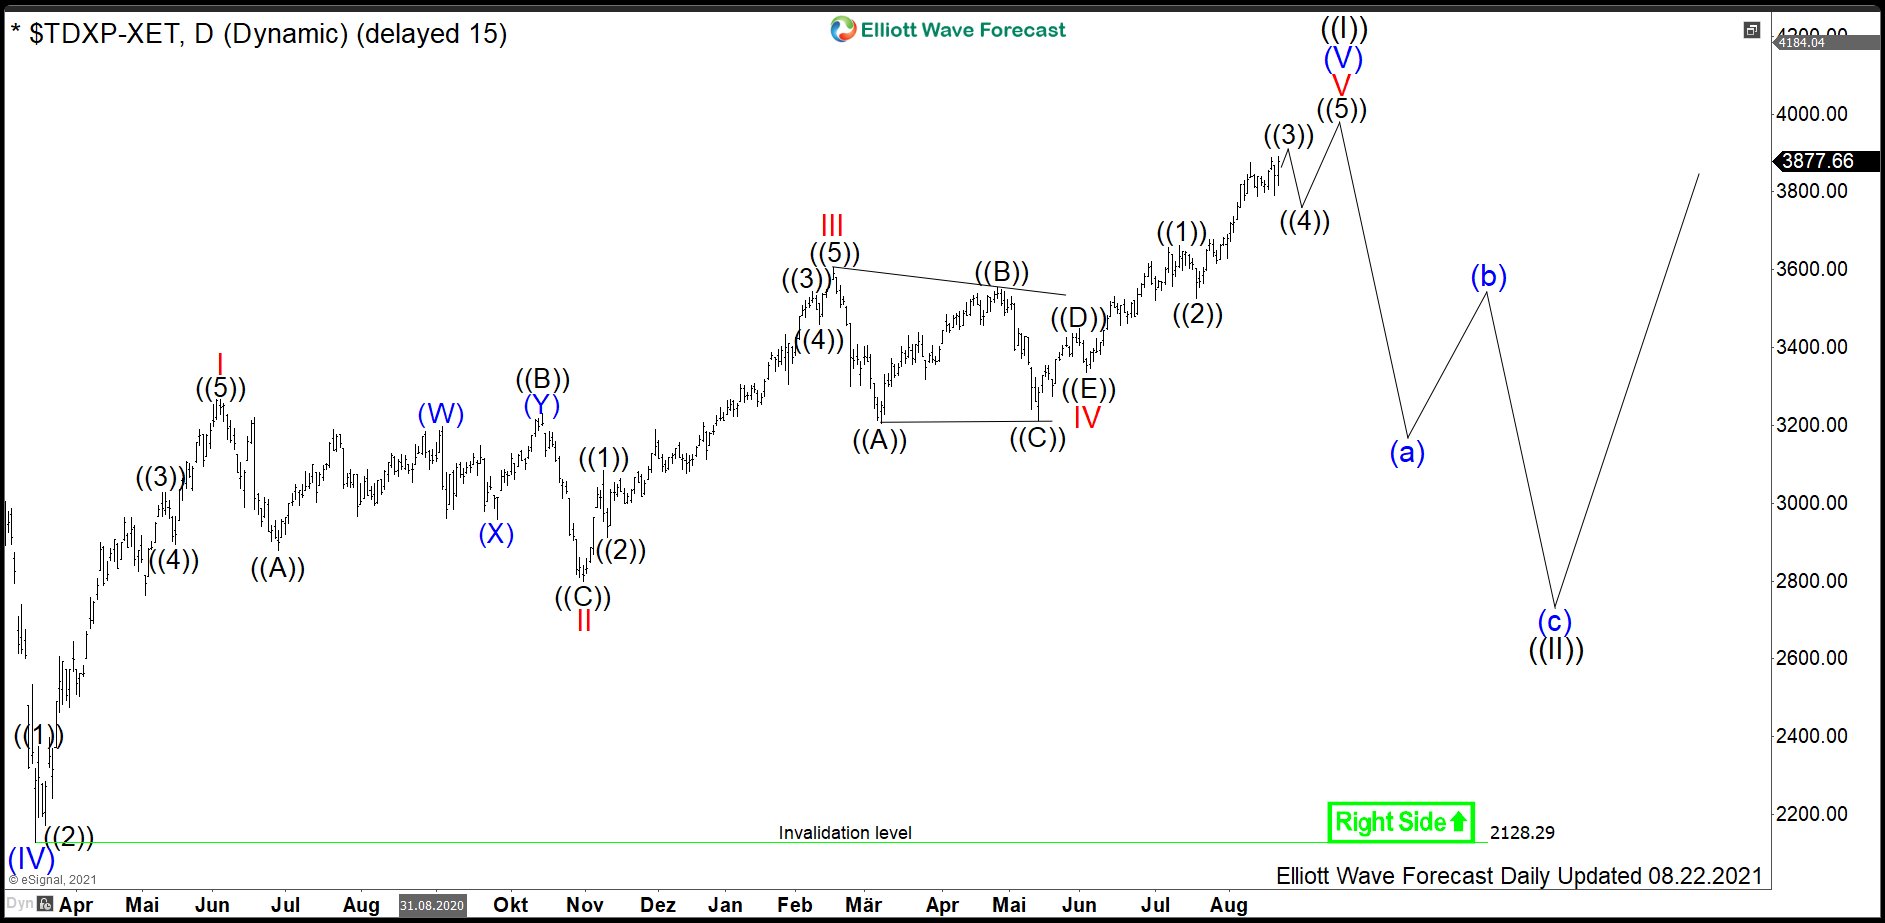
TecDAX Daily Elliott Wave Analysis 08.23.2021
The daily chart below shows in more detail the $TDXP price action from the March 2020 lows. The advance is an impulse in blue wave (V) which might be in the final stages. Red waves I-IV of a cycle degree have ended. Currently, red wave V is unfolding as a thrust out of a triangle in wave IV. On its own, red wave V looks like it is missing one swing more to the upside. Then, a larger correction can take place.
In a larger picture, TecDAX demonstrates enough number swings and can be correcting lower very soon. Hence, it is dangerous to buy the technology index from Germany at current levels. A consolidation move in wave ((II)) will provide another opportunity though. Investors and traders can, therefore, be looking to buy TecDAX in a pullback in 3, 7 or 11 swings into a larger wave ((III)) higher.