How Does it Work:
A likely scenario is proposed for today, and the probability of achieving this scenario according to technical analysis may be between 60% and 75%, but if the first scenario fails, here the probability of achieving the second scenario becomes between 60% and 75%.
The preferred scenario fails when the price reaches the level of the alternative scenario condition, and immediately gets triggered and cancels the prediction in the preferred scenario.
These reports are not considered a substitute for the trader’s decision, but rather an aid to the follower in making his own decisions, as a reference based on the origin of classic technical analysis.
(Eur/Usd)
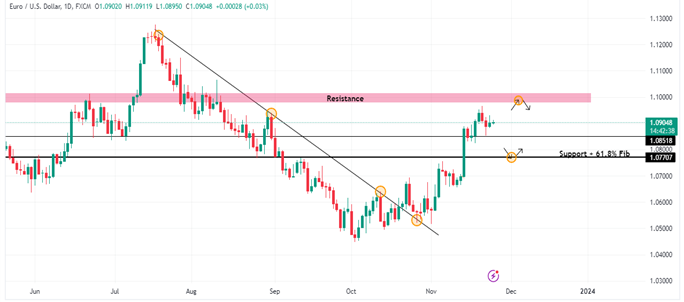
Bearish trend
First scenario: a rise towards 1.1000 if price holds above 1.0850
Second scenario: a fall towards 1.0720 if daily candle closes below 1.0850
(GBPUSD)
Bearish trend
First scenario: a rise towards 1.2600 if price holds above 1.2450
Second scenario: a fall towards 1.2380 if daily candle closes below 1.2450
Gold (Xau/Usd)
Bullish trend
First scenario: a rise towards 2006 if price holds above 1990
Second scenario: a fall towards 1980 if daily candle closes below 1990
(US30)
Bullish trend
First scenario: a rise towards 35600 if price holds above 35000
Second scenario: a fall towards 34650 if daily candle closes below 35000
(Us oil)
Bearish trend
First scenario: a fall towards 72.20 if daily candle closes below 75.50
Second scenario: a rise towards 79.20 if price holds above 75.50
Notice :
The analyzes and opinions contained in this report are not binding and are not considered recommendations to sell or buy, and the company is not responsible for the decisions and choices of the investor, and the aim of this report is to publish general information through technical analysis.