Recommendation for Brent Crude: Buy
Buy Stop : Above 43,8
Stop Loss : Below 38,8
| Indicator | Value | Signal |
|---|---|---|
| RSI | Buy | |
| MACD | Buy | |
| Parabolic SAR | Buy | |
| MA(200) | Neutral | |
| Fractals | Neutral | |
| Bollinger Bands | Neutral |
Chart Analysis
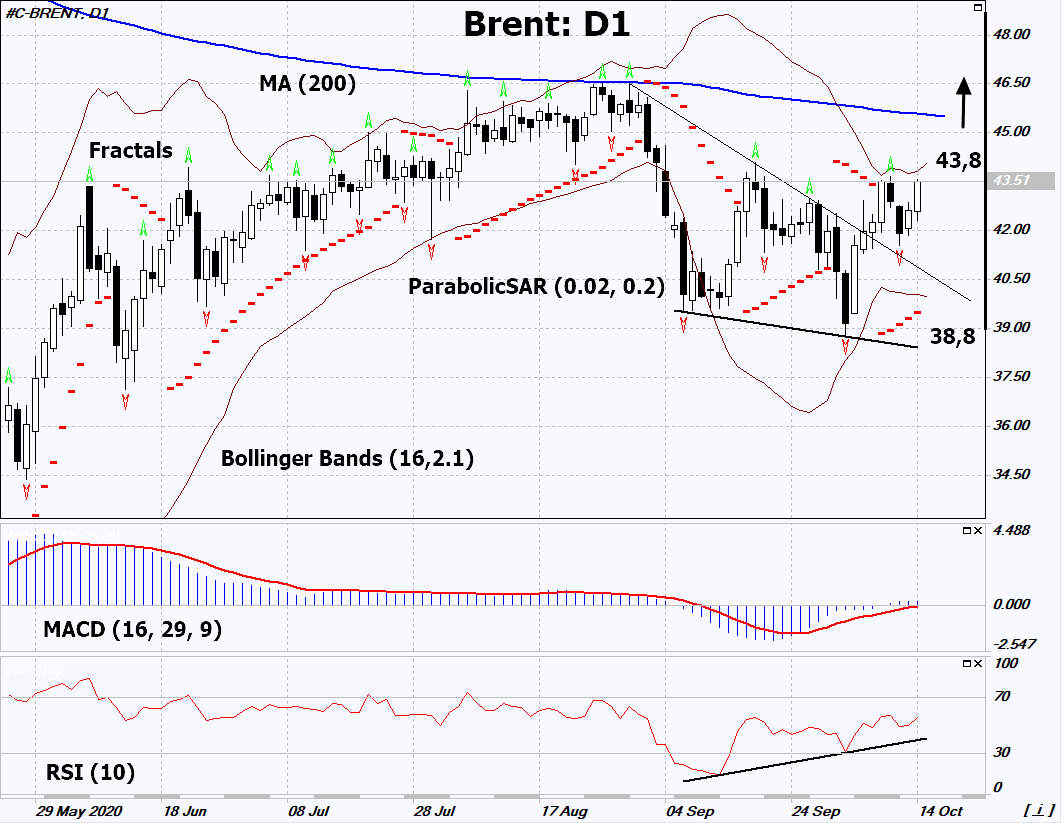
On the daily timeframe, Brent: D1 has exceeded the resistance line of the short-term downtrend. It is trying to continue the upward trend, but is currently traded in a narrow range. A number of technical analysis indicators formed signals for further growth. We do not exclude a bullish movement if Brent rises above the last upper fractal: 43.8. This level can be used as an entry point. We can place a stop loss below the Parabolic signal, the last 2 lower fractals and the lower Bollinger line: 38.8. After opening a pending order, we move the stop loss to the next fractal low following the Bollinger and Parabolic signals. Thus, we change the potential profit/loss ratio in our favor. After the transaction, the most risk-averse traders can switch to the four-hour chart and set a stop-loss, moving it in the direction of movement. If the price meets the stop loss (38.8) without activating the order (43.8), it is recommended to delete the order: market sustains some internal changes not taken into account.
Fundamental Analysis
The leaders of Saudi Arabia and Russia held negotiations on the regulation of the oil market. Will the Brent quotes grow?