Recommendation for COFFEE: Buy
Buy Stop : Above 114
Stop Loss : Below 105
| Indicator | Value | Signal |
|---|---|---|
| RSI | Buy | |
| MACD | Buy | |
| MA(200) | Neutral | |
| Fractals | Neutral | |
| Parabolic SAR | Buy | |
| Bollinger Bands | Neutral |
Chart Analysis
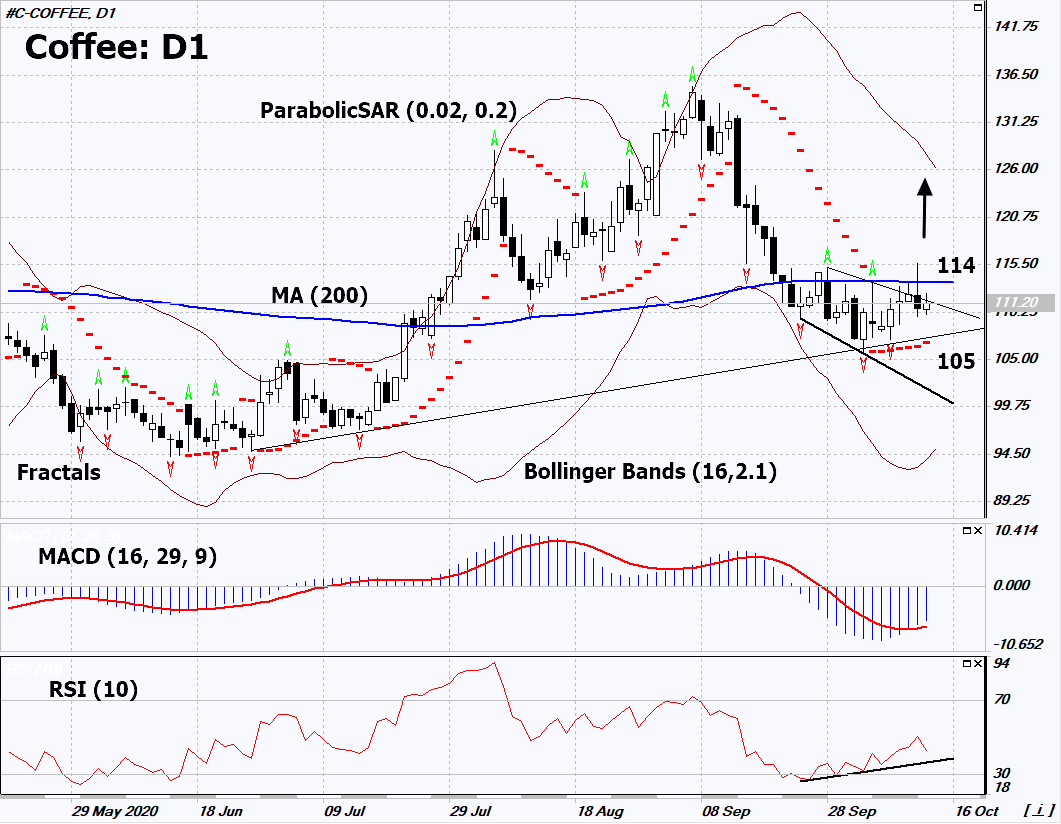
On the daily timeframe, Coffee: D1 approached the resistance line of the short-term downtrend. It must be broken upward before opening a position. A number of technical analysis indicators generated signals for further growth. We do not rule out a bullish move if Coffee rises above the last fractal upper and 200-day moving average line: 114. This level can be used as an entry point. We can place a stop loss below the Parabolic signal and 2 last lower fractals: 105. After opening a pending order, we move the stop loss following the Bollinger and Parabolic signals to the next fractal minimum. Thus, we change the potential profit/loss ratio in our favor. After the transaction, the most risk-averse traders can switch to the four-hour chart and set a stop-loss, moving it in the direction of the bias. If the price meets the stop loss (105) without activating the order (114), it is recommended to delete the order: some internal changes in the market have not been taken into account.
Fundamental Analysis
The U.S. Climate Prediction Center forecasts the formation of “La Nina” natural phenomenon this year, which could cause drought in Brazil. Will the Coffee quotes grow?