Recommendation for Corn:Sell
Sell Stop : Below 523.1
Stop Loss : Above 570.4
| Indicator | Value | Signal |
|---|---|---|
| MACD | Sell | |
| Donchian Channel | Sell | |
| MA(200) | Buy | |
| Fractals | Neutral | |
| Parabolic SAR | Sell | |
| On Balance Volume | Sell |
Chart Analysis
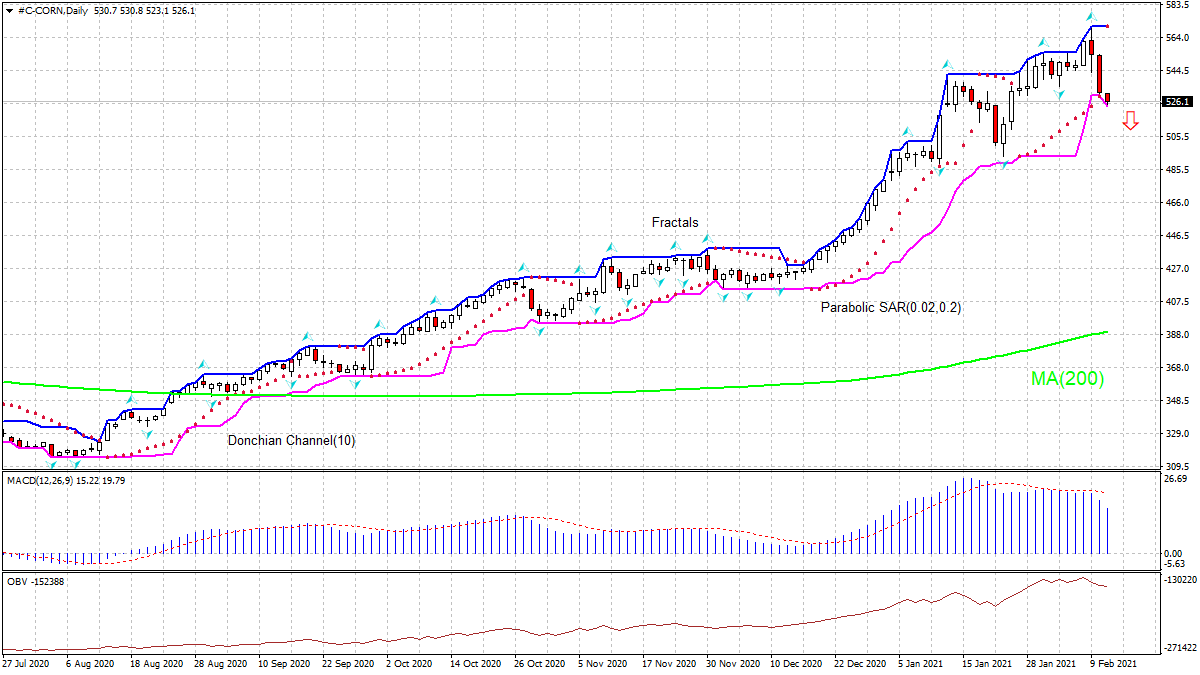
The CORN technical analysis of the price chart in daily timeframe shows #C-CORN,Daily is falling toward the 200-day moving average MA(200), which is rising itself. We believe the bearish momentum will continue as the price breaches below the lower Donchian boundary at 523.1. A pending order to sell can be placed below that level. The stop loss can be placed above 570.4. After placing the order, the stop loss is to be moved every day to the next fractal high, following Parabolic signals. Thus, we are changing the expected profit/loss ratio to the breakeven point. If the price meets the stop loss level without reaching the order, we recommend cancelling the order: the market has undergone internal changes which were not taken into account.
Fundamental Analysis
USDA upgraded its estimate for corn global supply in WASDE report. Will the CORN price continue retreating? USDA’s February 2021 World Agricultural Supply and Demand Estimates (WASDE) report upgraded corn production estimate. USDA raised slightly its estimate for global corn production, now at 1.439 billion metric tons. The agency forecasts higher ending stocks compared with January due to more production and lower consumption. It estimates global ending stocks rose modestly from January to 1.281 billion bushels. At the same time WASDE estimate for 2020/21 US corn ending stocks at 1.502 billion bushels was still notably higher than the average trade estimate of 1.392 billion bushels. Higher supply estimates are bearish for corn prices.
