Recommendation for Corn:Sell
Sell Stop : Below 606.9
Stop Loss : Above 636.6
RSI : Neutral
MACD : Sell
Donchian Channel : Sell
MA(200) : Sell
Fractals : Sell
Parabolic SAR : Sell
Chart Analysis
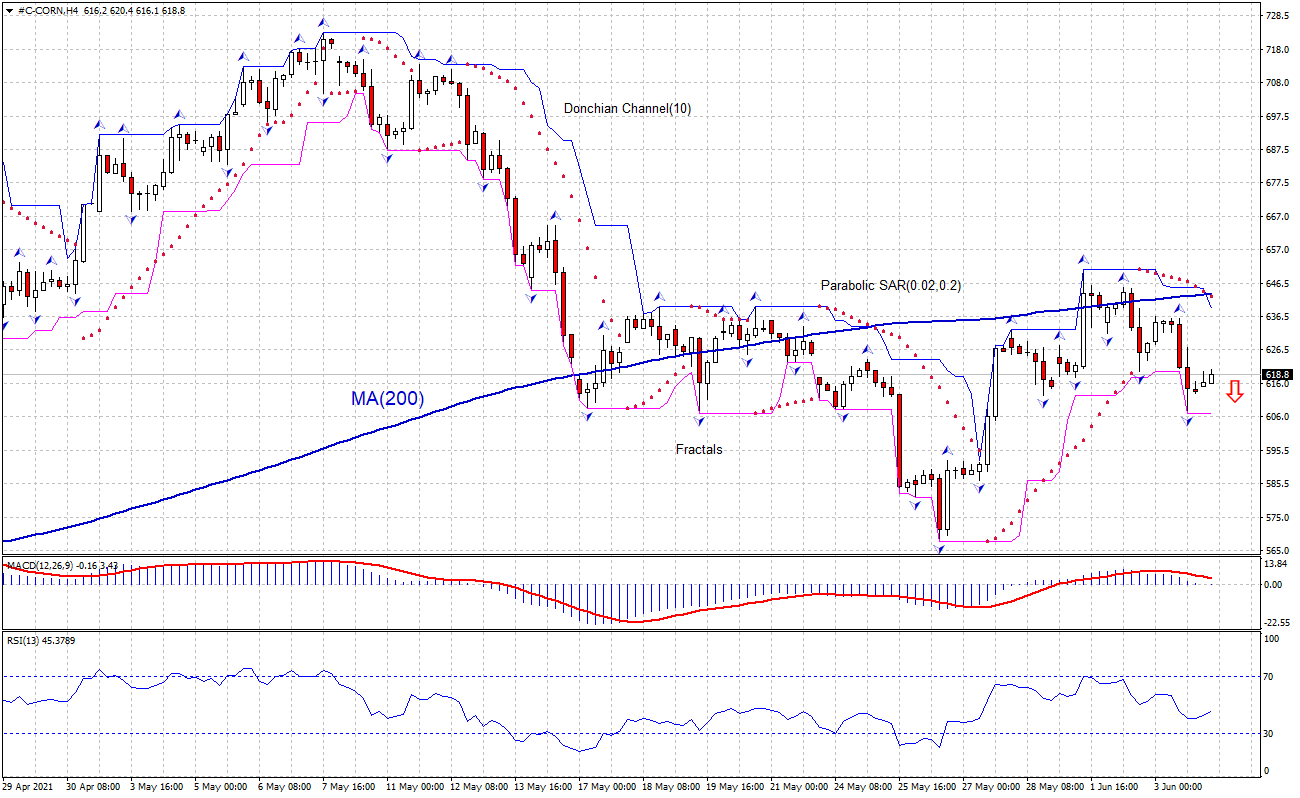
The #C-CORN technical analysis of the price chart in 4-hour timeframe shows #C-CORN,H4 is falling below the 200-period moving average MA(200), which is rising still. We believe the bearish momentum will continue as the price breaches below the lower Donchian boundary at 606.9. A pending order to sell can be placed below that level. The stop loss can be placed above 636.6. After placing the order, the stop loss is to be moved every day to the next fractal high, following Parabolic signals. Thus, we are changing the expected profit/loss ratio to the breakeven point. If the price meets the stop loss level without reaching the order, we recommend cancelling the order: the market has undergone internal changes which were not taken into account.
Fundamental Analysis
USDA released its first set of corn quality ratings for the 2021 corn. Will the CORN price continue retreating? On Tuesday US Department of Agriculture released its most recent corn crop progress report, as well as corn quality ratings for 2021. Corn plantings were 95% complete through Sunday, up from 90% a week ago. That’s a bit faster than 2020’s pace of 92% and moderately ahead of the prior five-year average of 87%. And 81% of the crop had emerged, up from 64% last week and well above the prior five-year average of 70%. At the same time quality ratings estimates for the 2021 corn crop showed 76% were rated in good-to-excellent conditions. That was much higher than market expectations, which averaged 70%. Higher quality corn supply estimates are bearish for corn prices