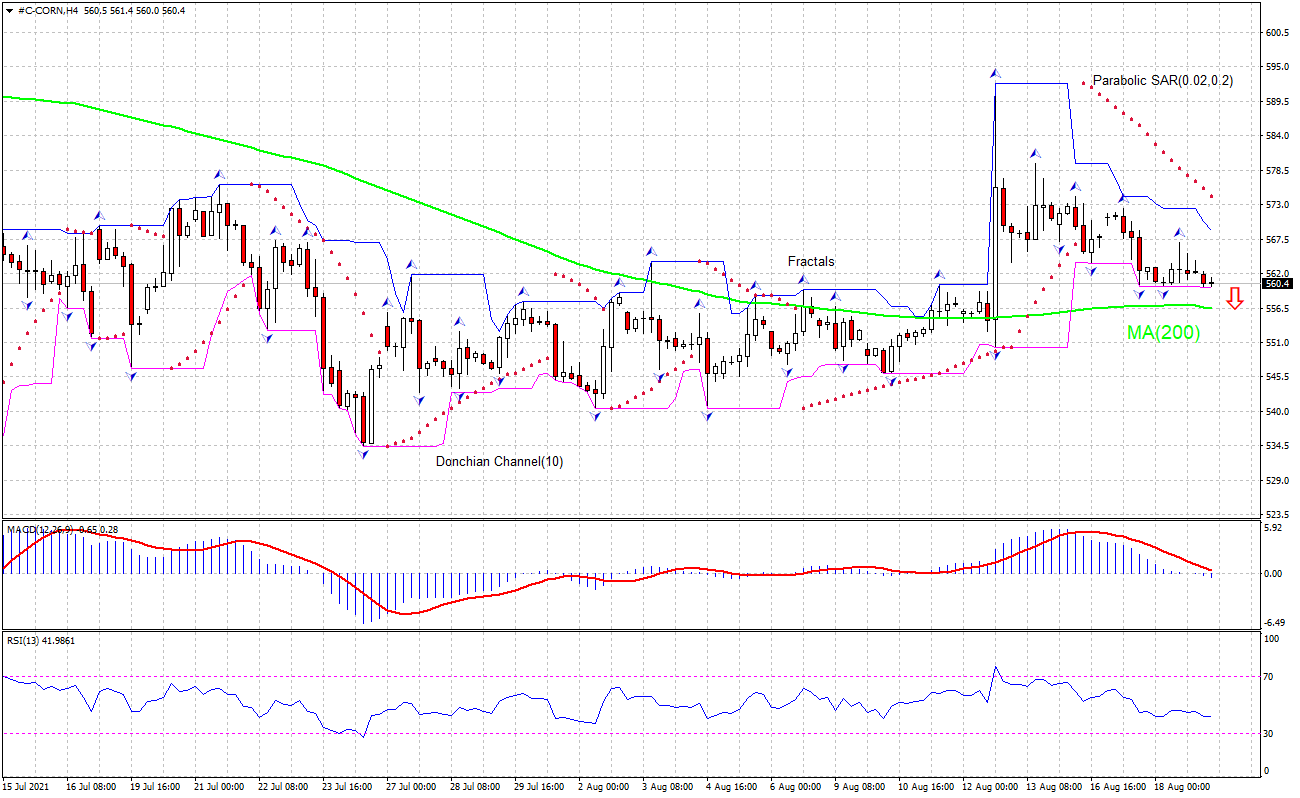
Recommendation for Corn: Sell
Sell Stop: Below 559.7
Stop Loss: Above 566.9
| Indicator | Signal |
|---|---|
| RSI | Neutral |
| MACD | Sell |
| Donchian Channel | Sell |
| MA(200) | Buy |
| Fractals | Sell |
| Parabolic SAR | Sell |
Chart Analysis
The #C-CORN technical analysis of the price chart in 4-hour timeframe shows #C-CORN,H4 is falling toward the 200-period moving average MA(200), which is tilting downward. We believe the bearish momentum will continue as the price breaches below the lower Donchian boundary at 559.7. A pending order to sell can be placed below that level. The stop loss can be placed above 566.9. After placing the order, the stop loss is to be moved every day to the next fractal high, following Parabolic signals. Thus, we are changing the expected profit/loss ratio to the breakeven point. If the price meets the stop loss level without reaching the order, we recommend cancelling the order: the market has undergone internal changes which were not taken into account.
Fundamental Analysis
USDA downgraded nationwide corn crop condition rating for 2021 corn. Will the CORN price retreating halt?
On Monday US Department of Agriculture released its latest Crop Progress Report indicating quality of the corn crop nationwide deteriorated. USDA’s weekly report showed that 62% of the corn crop nationally is rated good to excellent, down from 64% last week. Estimates of lower proportion of higher quality corn crop translate into expectations of lower supply of the commodity, which is bullish for the corn price. Another bullish factor for corn was a lower estimate for 2021/22 US corn production projection at 14,775 million bushels due to a lower yield forecast from the National Agricultural Statistics Service’s (NASS) Crop Production report. However, the technical setup is bearish for #C-CORN.
