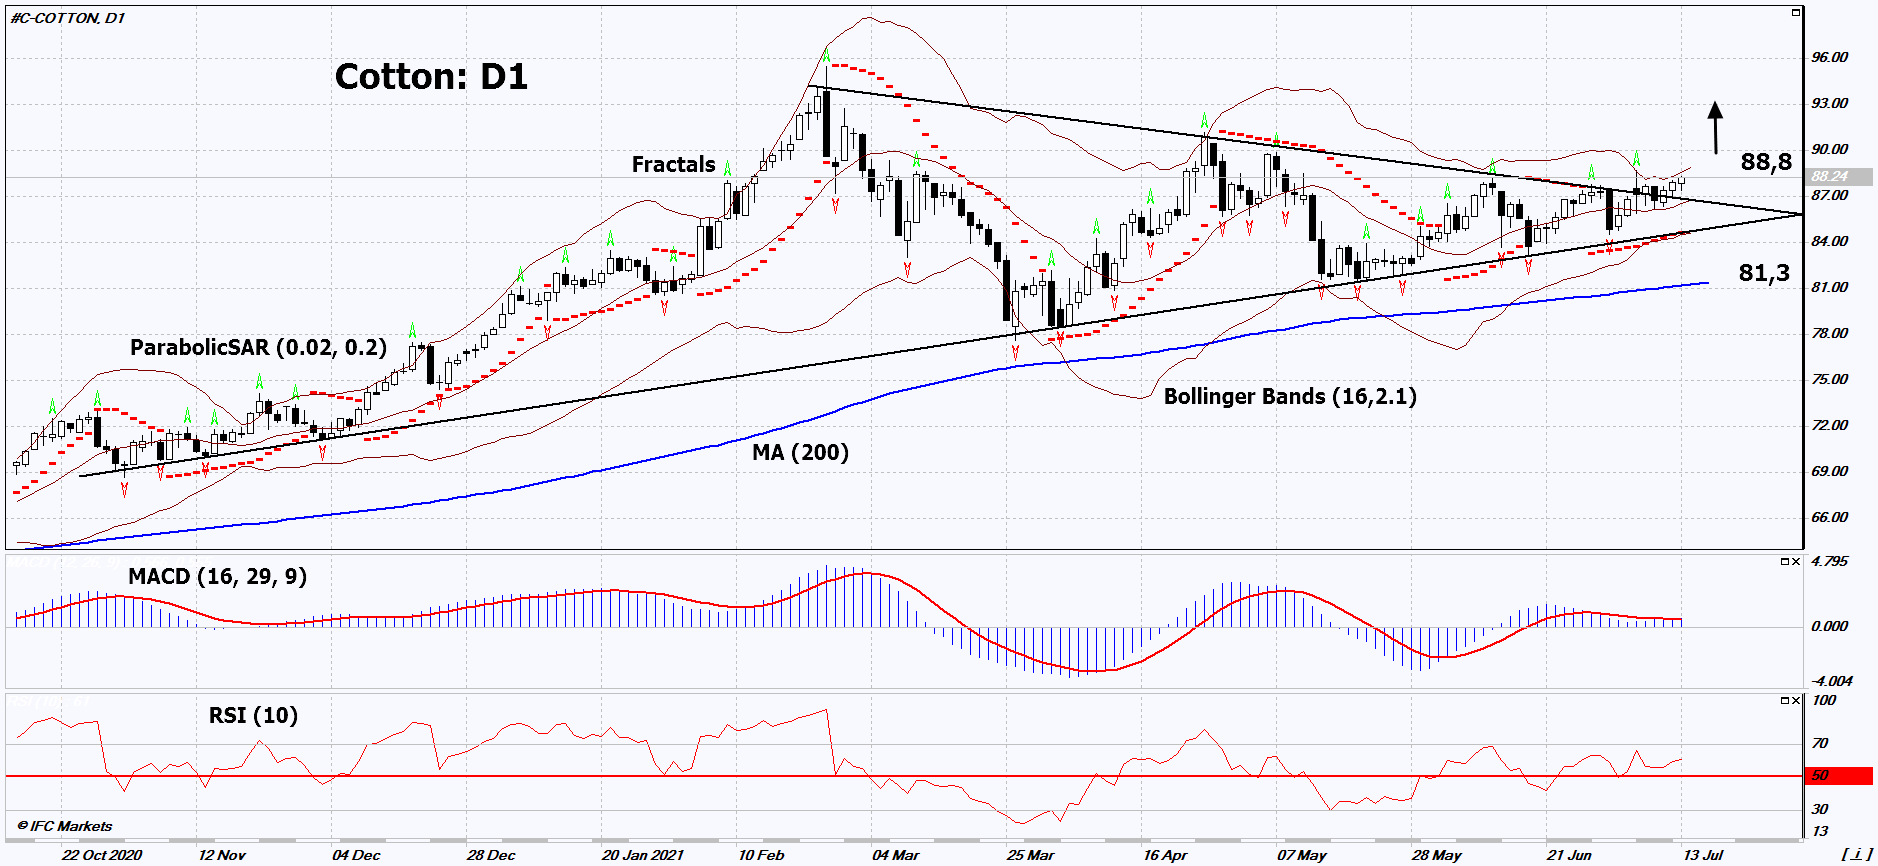
Recommendation for Cotton:Buy
Buy Stop : Above 88.8
Stop Loss : Below 81.3
RSI : Neutral
MACD : Neutral
MA(200) : Neutral
Fractals : Neutral
Parabolic SAR : Buy
Bollinger Bands : Buy
Chart Analysis
On the daily timeframe, Cotton: D1 moved up out of the triangle. A number of technical analysis indicators have formed signals for further growth. We do not exclude a bullish movement if Cotton rises above the last fractal upper and upper Bollinger band: 88.8. This level can be used as an entry point. Initial risk limitation is possible below the Parabolic signal, the 200-day moving average and the lower Bollinger line: 81.3. After opening a pending order, move the stop following the Bollinger and Parabolic signals to the next fractal low. Thus, we change the potential profit / loss ratio in our favor. The most cautious traders, after making a deal, can go to the four-hour chart and set a stop-loss, moving it in the direction of movement. If the price overcomes the stop level (81.3) without activating the order (88.8), it is recommended to delete the order: there are internal changes in the market that were not taken into account.
Fundamental Analysis
The United States Department of Agriculture (USDA) reported a decline in US cotton plantings. Will the Cotton quotes continue to rise? According to the USDA, the US cotton planted area in 2021 was 11.72 million acres. This is 3% less than in 2020. The forecast for US cotton exports in the 2021/2022 season has been increased by 400,000 bales to 15.2 million bales. The slowdown in cotton sowing in India due to the lack of precipitation may become a positive factor for quotations. According to the Indian Ministry of Agriculture & Farmers’ Welfare, cotton has now been planted on an area of 8.6 million hectares. This is 18.5% lower than last year’s level of 10.5 million hectares on the same date. As of July 7, precipitation in India was 46% below average. Earlier, the USDA predicted that global cotton consumption in the 2021/2022 season will increase by 3.5% to 122 million bales and exceed the pre-covid level of the 2018/2019 season. At the same time, global consumption will still be below the historically maximum level of 2017/2018. The main increase in cotton consumption may occur in the world’s clothing-producing countries: India, Bangladesh, Turkey, Pakistan and Vietnam.
