Recommendation for Live Cattle :Buy
Buy Stop : Above 114,6
Stop Loss : Below 108,6
| Indicator | Value | Signal |
|---|---|---|
| RSI | Neutral | |
| MACD | Sell | |
| MA(200) | Neutral | |
| Fractals | Neutral | |
| Parabolic SAR | Buy | |
| Bollinger Bands | Buy |
Chart Analysis
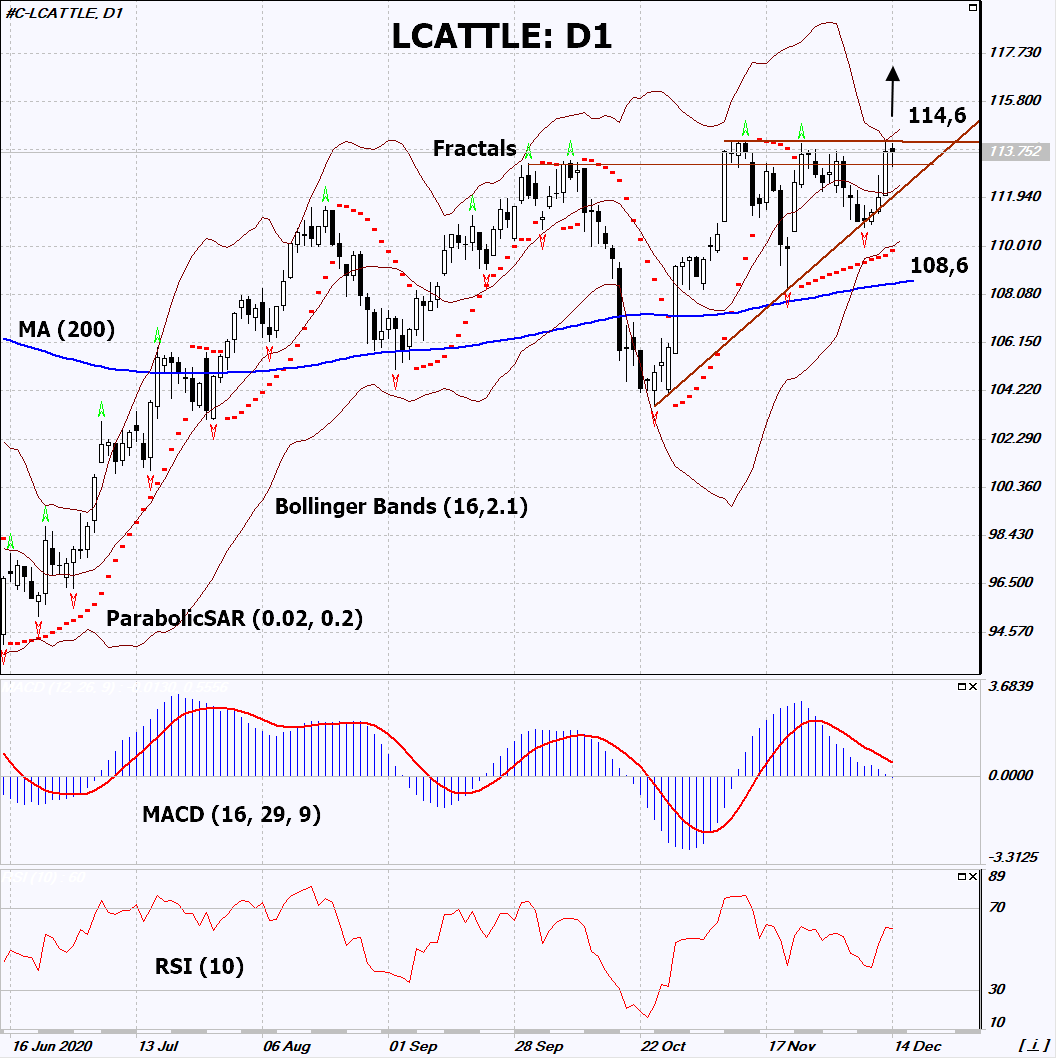
On the daily timeframe, LCATTLE: D1 has formed a triangle pattern, which should be broken up before opening a position. A number of technical analysis indicators formed signals for further growth. We do not exclude a bullish movement if LCATTLE rises above its last upper fractal and upper Bollinger band: 114.6. This level can be used as an entry point. We can place a stop loss below the Parabolic signal, the lower Bollinger band, 200-day moving average line and the last lower fractal: 108.6. After opening a pending order, we move the stop loss to the next fractal low following the Bollinger and Parabolic signals. Thus, we change the potential profit/loss ratio in our favor. After the transaction, the most risk-averse traders can switch to the four-hour chart and place a stop loss, moving it in the direction of the bias. If the price meets the stop loss (108.6) without activating the order (114.6), it is recommended to delete the order: the market sustains internal changes that have not been taken into account.
Fundamental Analysis
Rising prices of oats and other grains may increase the animal feed prices. Will the LCATTLE quotes continue to grow?