Recommendation for Natural Gas : Sell
Sell Stop : Below 2,94
Stop Loss : Above 3,4
| Indicator | Value | Signal |
|---|---|---|
| RSI | Sell | |
| MACD | Sell | |
| MA(200) | Neutral | |
| Fractals | Neutral | |
| Parabolic SAR | Sell | |
| Bollinger Bands | Sell |
Chart Analysis
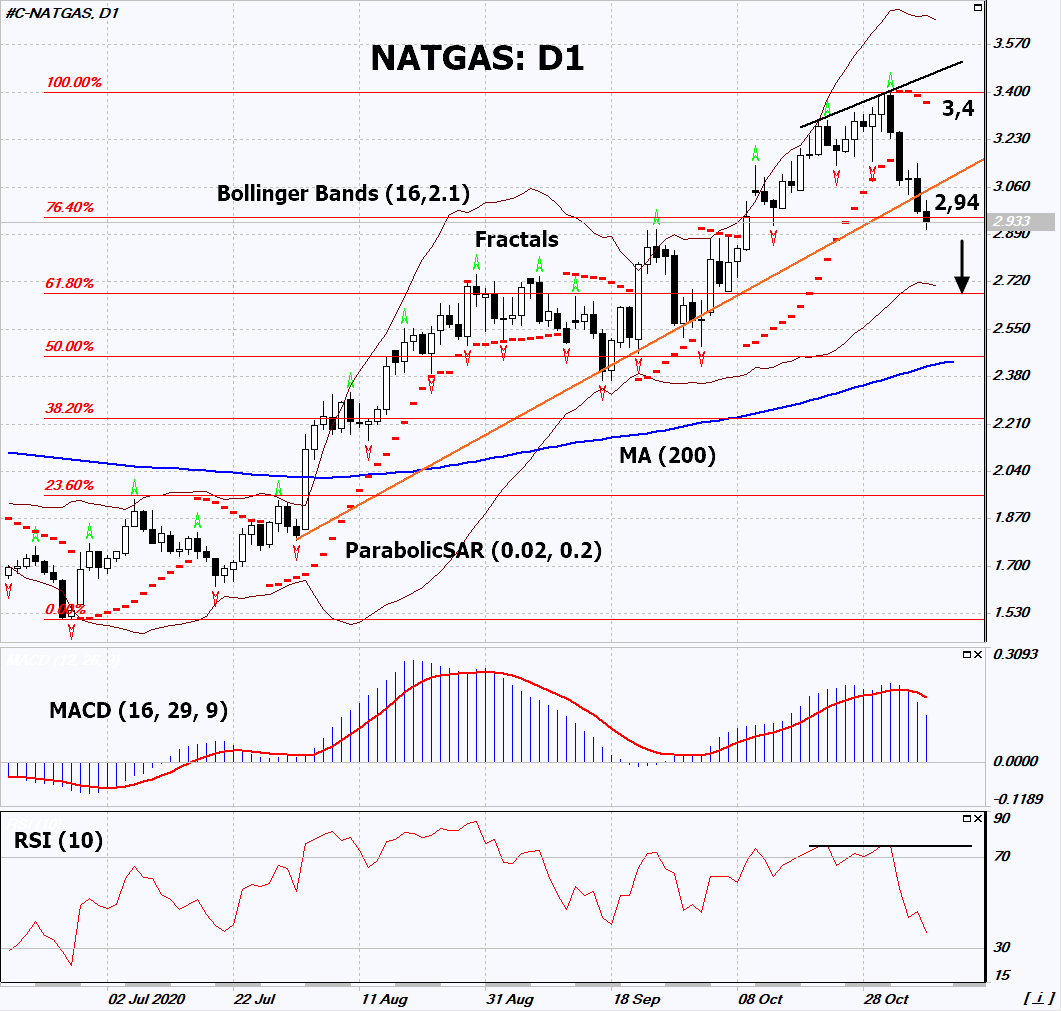
On the daily timeframe, NATGAS: D1 is correcting downward from the maximum since January 2019. It broke down the uptrend support line. A number of technical analysis indicators generated signals for further decline. We do not rule out a bearish movement if NATGAS falls below the 1st Fibonacci line: 2.94. This level can be used as an entry point. We can place a stop loss above the last upper fractal and Parabolic signal: 3.4. After opening a pending order, we can move the stop loss to the next fractal maximum following the Bollinger and Parabolic signals. Thus, we change the potential profit/loss ratio in our favor. After the transaction, the most risk-averse traders can switch to the 4-hour chart and set a stop loss, moving it in the direction of the bias. If the price meets the stop loss (3.4) without activating the order (2.94), it is recommended to delete the order: some internal changes in the market have not been taken into account.
Fundamental Analysis
Warm weather in the USA can last 2 more weeks. Will the NATGAS quotes continue to decline?