Recommendation for Oats:Sell
Sell Stop : Below 358
Stop Loss : Above 398
RSI : Sell
MACD : Sell
MA(200) : Neutral
Fractals : Neutral
Parabolic SAR : Sell
Bollinger Bands : Neutral
Chart Analysis
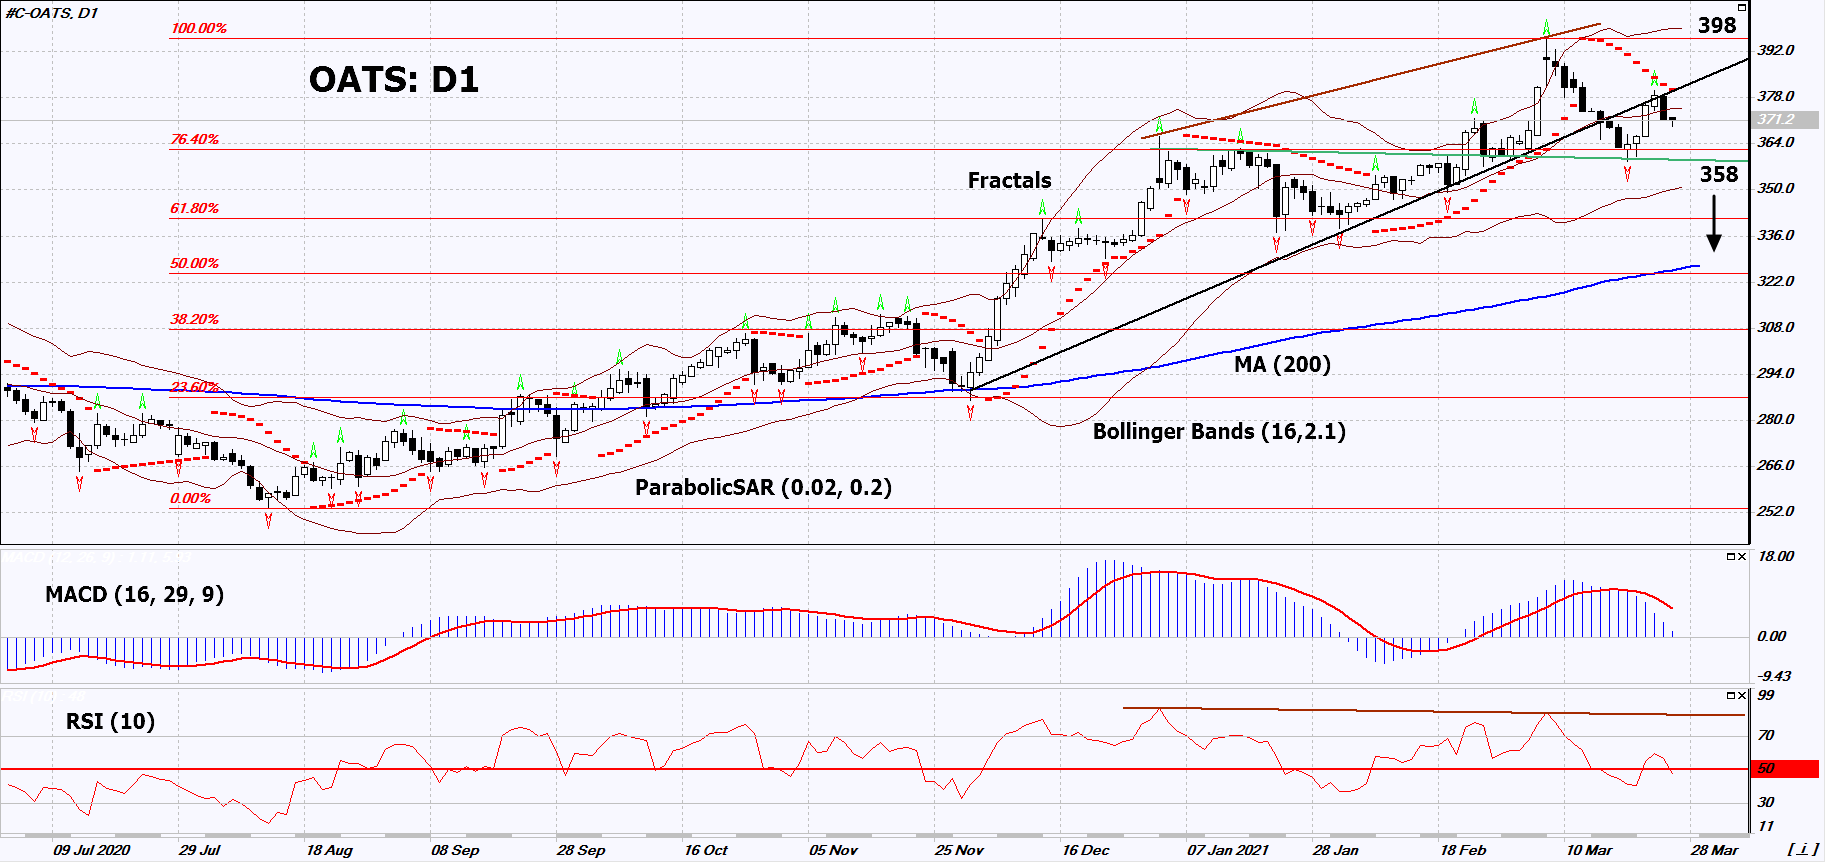
On the daily timeframe, OATS: D1 broke down the uptrend support line. A number of technical analysis indicators formed signals for further decline. We do not exclude a bearish move if OATS falls below the last lower fractal: 358. This level can be used as an entry point. We can place a stop loss above the maximum since March 2014, the upper Bollinger line and the Parabolic signal: 398. After opening the pending order, we can move the stop loss following the Bollinger and Parabolic signals to the next fractal maximum. Thus, we change the potential profit/loss ratio in our favor. After the transaction, the most risk-averse traders can switch to the four-hour chart and place a stop loss, moving it in the direction of the trend. If the price meets the stop loss (398) without activating the order (358), it is recommended to delete the order: the market sustains internal changes that have not been taken into account.
Fundamental Analysis
The United States Department of Agriculture (USDA) confirmed its forecast for the oat harvest. Will the OATS quotes move down? At the end of 2020, the oat crop in the United States grew by 23% and amounted to 65.4 million bushels. APK-Inform Agency reported an increase in the export of oats from Ukraine in July-February of the 2020/2021 season to 13 thousand tons. This is 56% more compared to the same period in the previous season. The oat harvest in Ukraine in the 2020/2021 agricultural season may grow by 21% and amount to 511 thousand tons.