Recommendation for Soybean: Buy
Buy Stop : Above 905
Stop Loss : Below 865
| Indicator | Value | Signal |
|---|---|---|
| RSI | Neutral | |
| MACD | Neutral | |
| MA(200) | Neutral | |
| Fractals | Neutral | |
| Parabolic SAR | Buy | |
| Bollinger Bands | Neutral |
Chart Analysis
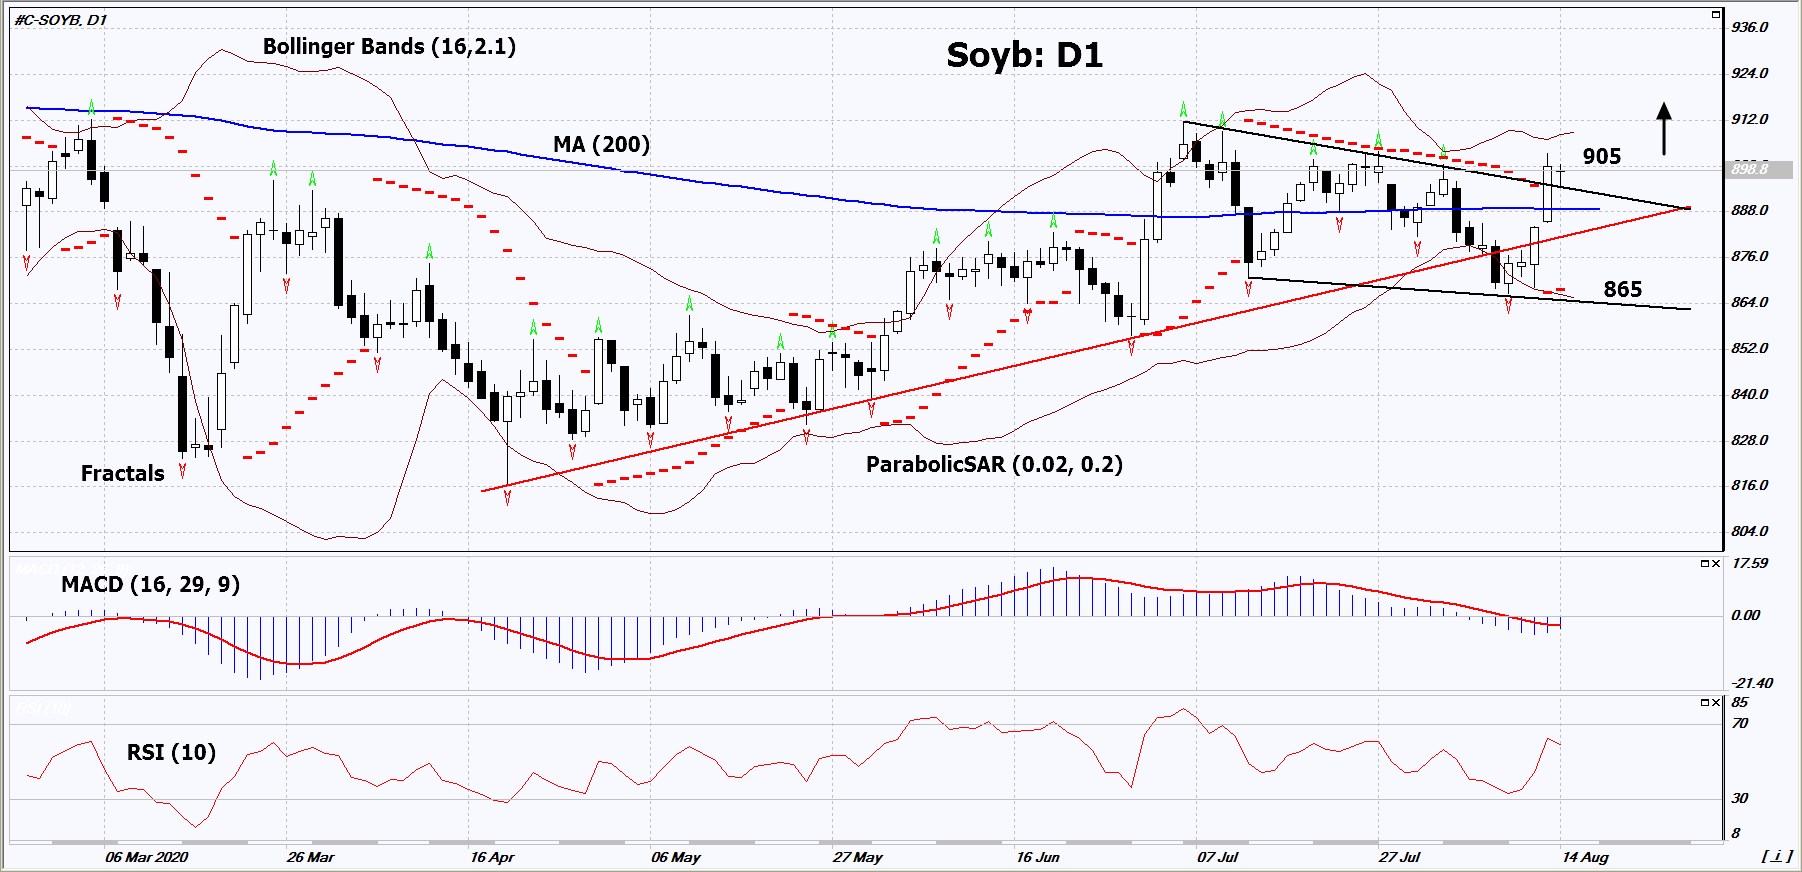
On the daily timeframe, Soyb: D1 returned to an uptrend and exited the downward channel. We do not exclude a bullish move if Soyb rises above its last high and the last two upper fractals: 905. This level can be used as an entry point. We can set a stop loss below the Parabolic signal, the last lower fractal and the lower Bollinger line: 865. After opening a pending order, we move the stop loss following the Bollinger and Parabolic signals to the next fractal low. Thus, we change the potential profit/loss ratio in our favor. After the transaction, the most risk-averse traders can switch to the four-hour chart and set a stop loss, moving it in the direction of the bias. If the price meets the stop loss (865) without activating the order (905), it is recommended to delete the order: the market sustains internal changes not taken into account.
Fundamental Analysis
The US Department of Agriculture (USDA) announced the sale of a batch of American soybeans to China. Will the Soyb prices rise?