Recommendation for Soybean Meal: Sell
Sell Stop ։ Below 388
Stop Loss ։ Above 404
| Indicator | Value | Signal |
|---|---|---|
| RSI | Sell | |
| MACD | Sell | |
| MA(200) | Neutral | |
| Fractals | Neutral | |
| Parabolic SAR | Buy | |
| Bollinger Bands | Neutral |
Chart Analysis
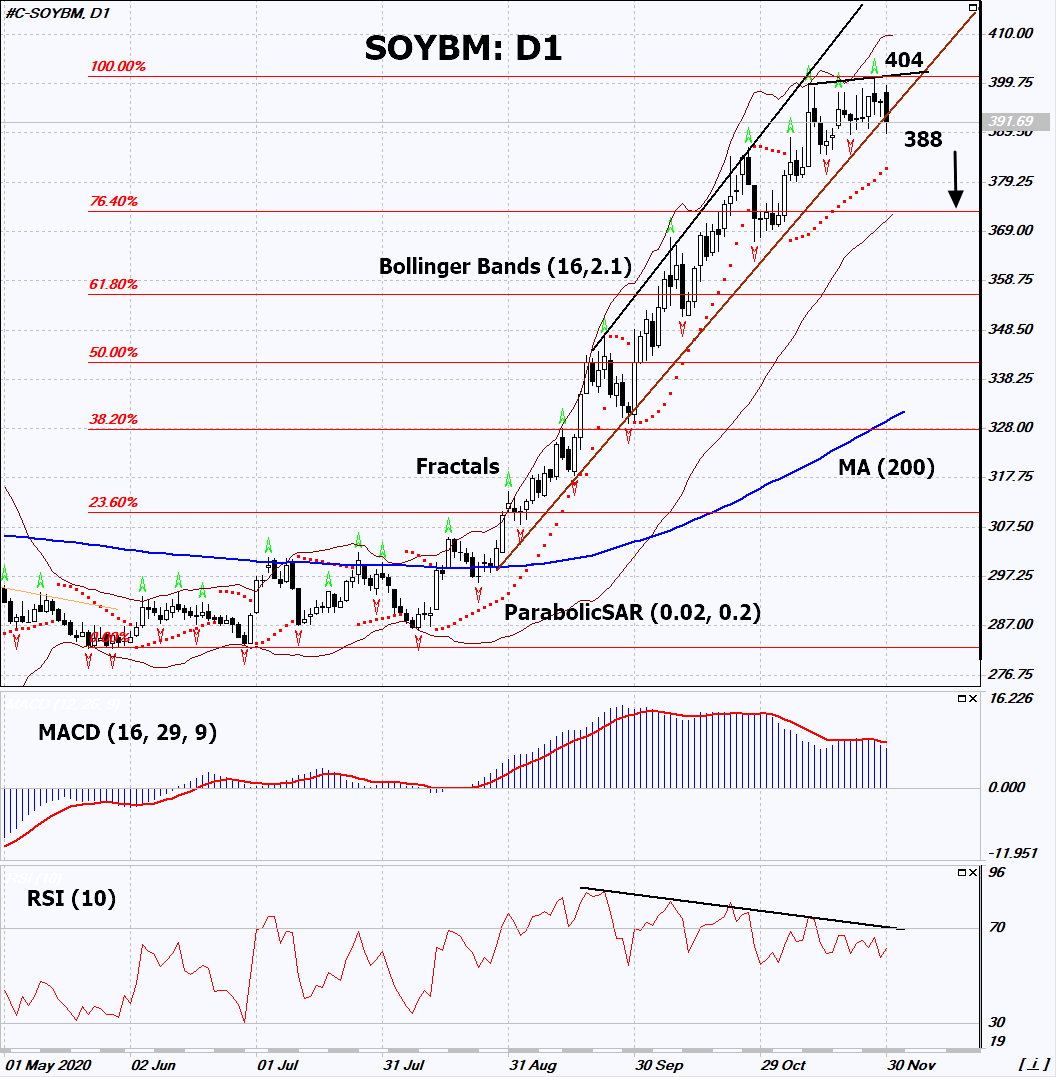
On the daily timeframe, SOYBM: D1 is correcting down from the high since April 2018. It approached the uptrend support line which must be broken down before opening a position. A number of technical analysis indicators formed signals for further decline. We do not exclude a bearish movement if SOYBM falls below the last lower fractal: 388. This level can be used as an entry point. We can place a stop loss above the last upper fractal: 404. After opening a pending order, we can move the stop loss following the Bollinger and Parabolic signals to the next fractal maximum. Thus, we change the potential profit/loss ratio in our favor. After the transaction, the most risk-averse traders can switch to the four-hour chart and set a stop loss, moving it in the direction of the bias. If the price meets the stop loss (404) without activating the order (388), it is recommended to delete the order: the market sustains internal changes that have not been taken into account.
Fundamental Analysis
US soybean exports last week were the lowest in the current marketing year. Will the SOYBM quotes decline?