| Indicator | Value | Signal |
|---|---|---|
| RSI | Buy | |
| MACD | Sell | |
| MA(200) | Neutral | |
| Fractals | Neutral | |
| Parabolic SAR | Buy | |
| Bollinger Bands | Buy |
Chart Analysis
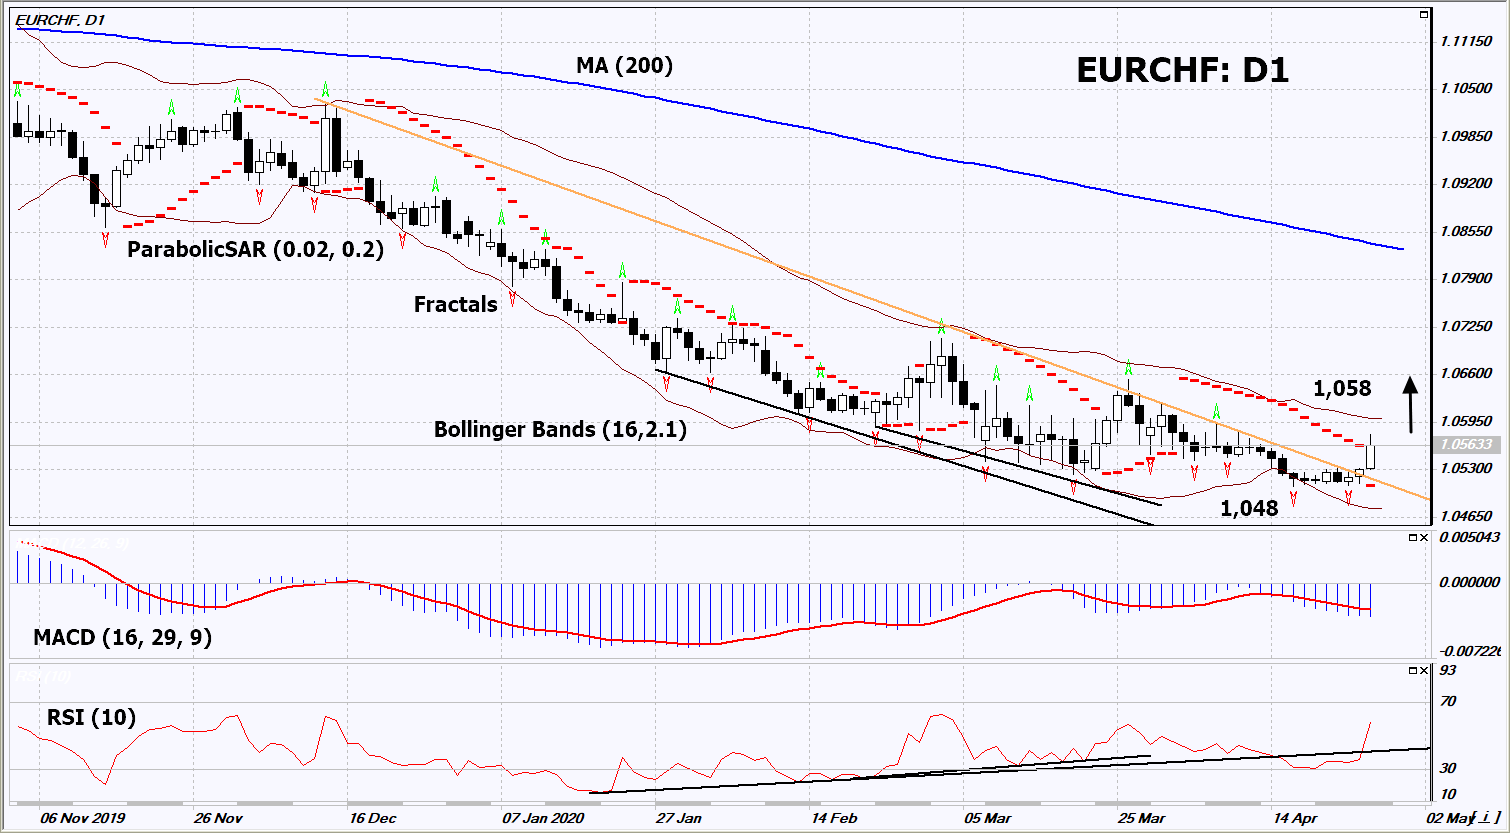
On the daily timeframe, EURCHF: D1 moved up from the downtrend. A range of indicators of technical analysis formed signals for a further increase. We do not exclude bullish movement if EURCHF rises above its last maximum: 1,058. This level can be used as an entry point. We can set a stop loss below the last two lower fractals, the Parabolic signal and the minimum since July 2015: 1.048. After opening the pending order, we move the stop loss after the Bollinger and Parabolic signals to the next fractal minimum. Thus, we change the potential profit / loss ratio in our favor. After the transaction, the most risk-averse traders can switch to a four-hour chart and set a stop loss, moving it in the direction of the trend. If the price meets the stop level (1,048) without activating the order (1,058), it is recommended to delete the order: perhaps, some internal changes in the market have not been taken into account.
Fundamental Analysis
Swiss National Bank (SNB) announced an increase in deposits over the past week by 13.4 billion Swiss francs. This is the maximum growth since January 2015. Will EURCHF quotes rise?